29
/de/
de
AIzaSyAYiBZKx7MnpbEhh9jyipgxe19OcubqV5w
April 1, 2024
141925
Greece
GRC
true
2
1
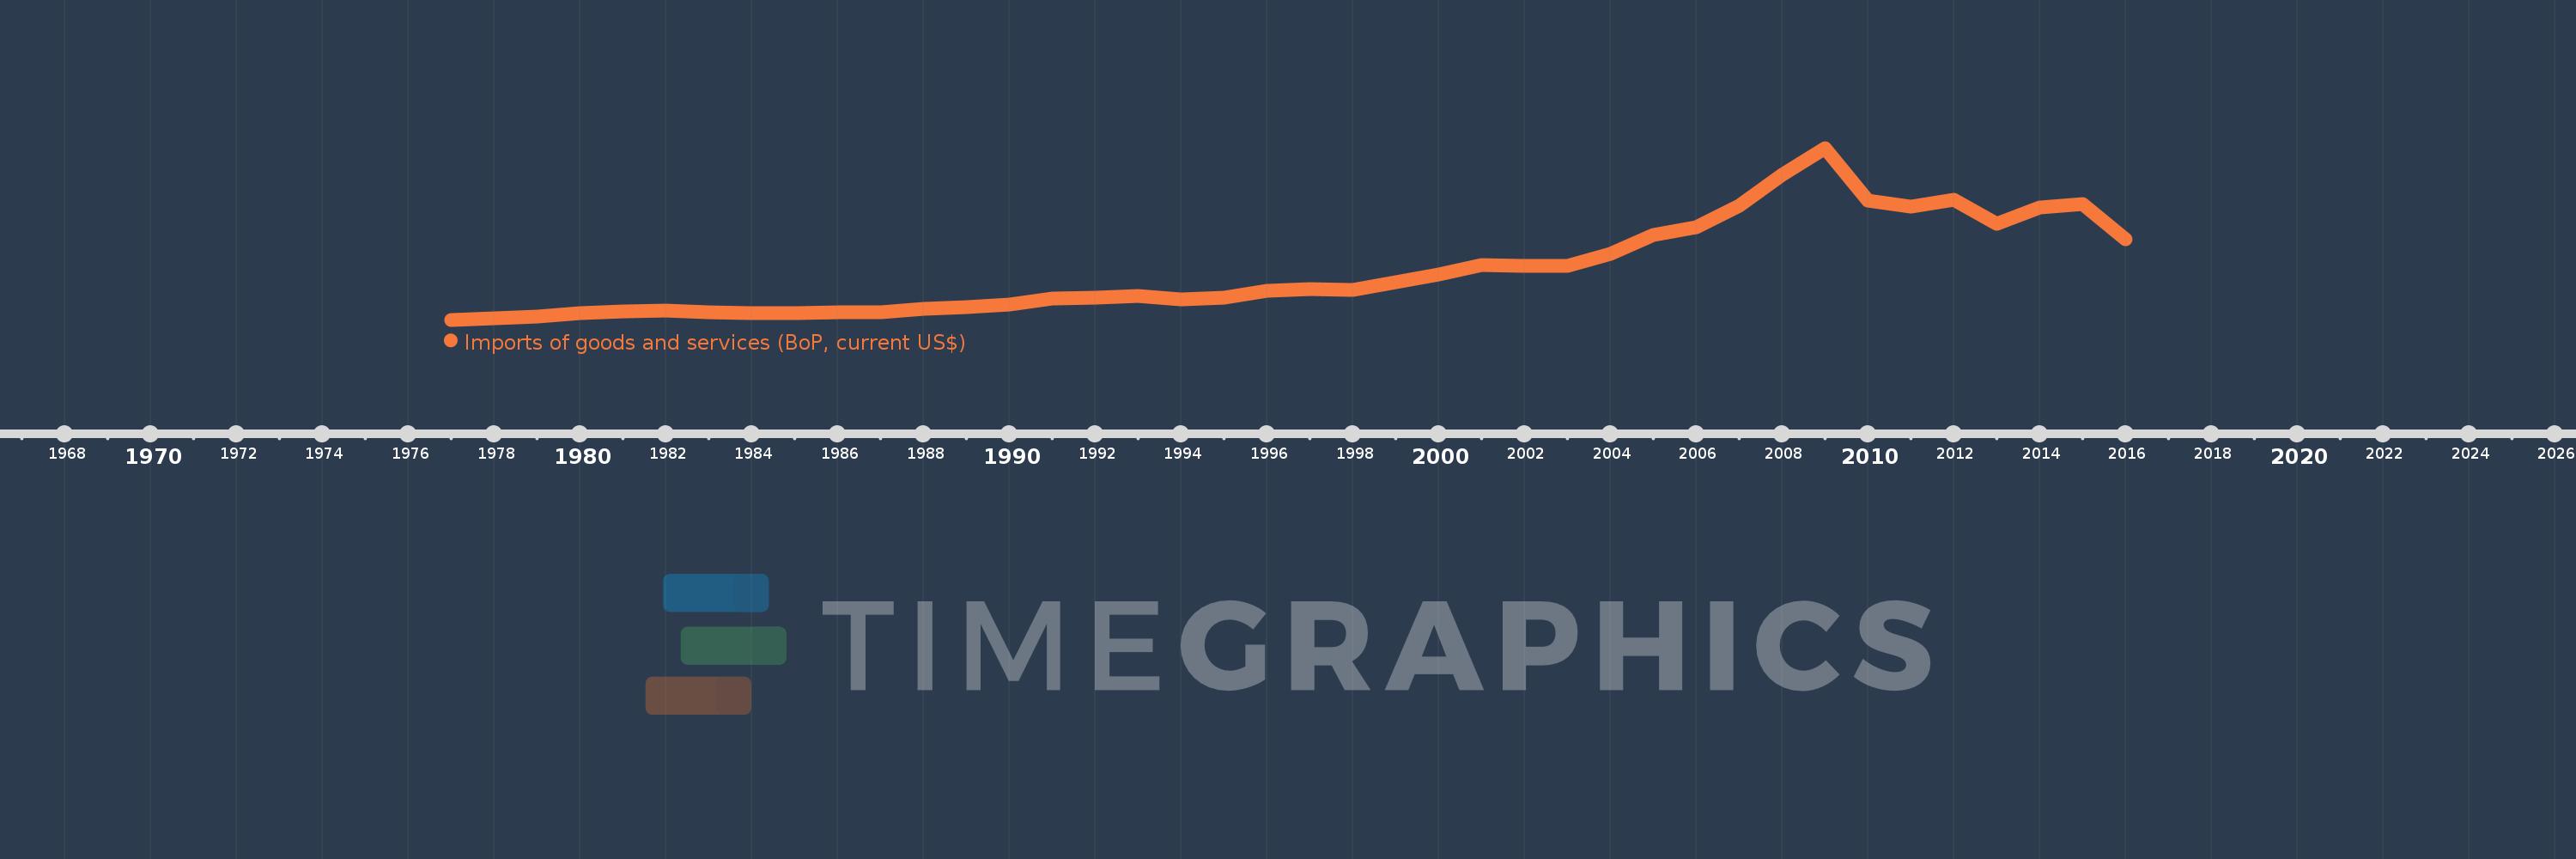
Imports of goods and services (BoP, current US$)
2016,2015,2014,2013,2012,2011,2010,2009,2008,2007,2006,2005,2004,2003,2002,2001,2000,1998,1997,1996,1995,1994,1993,1992,1991,1990,1989,1988,1987,1986,1985,1984,1983,1982,1981,1980,1979,1978,1977
Diese Statistik in anderen Ländern:
AfghanistanAlbaniaAlgeriaAngolaAntigua and BarbudaArab WorldArgentinaArmeniaArubaAustraliaAustriaAzerbaijanBahamas, TheBahrainBangladeshBarbadosBelarusBelgiumBelizeBeninBermudaBhutanBoliviaBosnia and HerzegovinaBotswanaBrazilBrunei DarussalamBulgariaBurkina FasoBurundiCabo VerdeCambodiaCameroonCanadaCaribbean small statesCentral African RepublicCentral Europe and the BalticsChadChileChinaColombiaComorosCongo, Dem. Rep.Congo, Rep.Costa RicaCote d'IvoireCroatiaCuracaoCyprusCzech RepublicDenmarkDjiboutiDominicaDominican RepublicEarly-demographic dividendEast Asia & PacificEast Asia & Pacific (excluding high income)East Asia & Pacific (IDA & IBRD countries)EcuadorEgypt, Arab Rep.El SalvadorEquatorial GuineaEritreaEstoniaEthiopiaEuro areaEurope & Central AsiaEurope & Central Asia (excluding high income)Europe & Central Asia (IDA & IBRD countries)European UnionFaroe IslandsFijiFinlandFragile and conflict affected situationsFranceFrench PolynesiaGabonGambia, TheGeorgiaGermanyGhanaGreeceGrenadaGuatemalaGuineaGuinea-BissauGuyanaHaitiHeavily indebted poor countries (HIPC)High incomeHondurasHong Kong SAR, ChinaHungaryIBRD onlyIcelandIDA & IBRD totalIDA blendIDA onlyIDA totalIndiaIndonesiaIran, Islamic Rep.IraqIrelandIsraelItalyJamaicaJapanJordanKazakhstanKenyaKiribatiKorea, Rep.KosovoKuwaitKyrgyz RepublicLao PDRLate-demographic dividendLatin America & Caribbean Latin America & Caribbean (excluding high income)Latin America & the Caribbean (IDA & IBRD countries)LatviaLeast developed countries: UN classificationLebanonLesothoLiberiaLibyaLithuaniaLow & middle incomeLow incomeLower middle incomeLuxembourgMacao SAR, ChinaMacedonia, FYRMadagascarMalawiMalaysiaMaldivesMaliMaltaMarshall IslandsMauritaniaMauritiusMexicoMicronesia, Fed. Sts.Middle East & North Africa (excluding high income)Middle East & North Africa (IDA & IBRD countries)Middle incomeMoldovaMongoliaMontenegroMoroccoMozambiqueMyanmarNamibiaNepalNetherlandsNew CaledoniaNicaraguaNigerNigeriaNorth AmericaNorwayOECD membersOmanOther small statesPacific island small statesPakistanPalauPanamaPapua New GuineaParaguayPeruPhilippinesPolandPortugalPost-demographic dividendPre-demographic dividendQatarRomaniaRussian FederationRwandaSamoaSao Tome and PrincipeSaudi ArabiaSenegalSerbiaSeychellesSierra LeoneSingaporeSint Maarten (Dutch part)Slovak RepublicSloveniaSmall statesSolomon IslandsSouth AfricaSouth AsiaSouth Asia (IDA & IBRD)South SudanSpainSri LankaSt. Kitts and NevisSt. LuciaSt. Vincent and the GrenadinesSub-Saharan Africa Sub-Saharan Africa (excluding high income)Sub-Saharan Africa (IDA & IBRD countries)SudanSurinameSwazilandSwedenSwitzerlandSyrian Arab RepublicTajikistanTanzaniaThailandTimor-LesteTogoTongaTrinidad and TobagoTunisiaTurkeyTuvaluUgandaUkraineUnited KingdomUnited StatesUpper middle incomeUruguayVanuatuVenezuela, RBVietnamWest Bank and GazaWorldYemen, Rep.ZambiaZimbabwe Zeitlinie:
Diese Zeitleiste vorliegt die Graphik ab 1977 J. bis 2016 J. Greece. Die Angaben bis 1976 J. sind nicht vorhanden. Die Zahl aktueller Beobachtungen nach Daten: 39.
Die Quelle (Bezeichnung):
Kennzahlen der Weltentwicklung
Die Quelle (Einrichtung):
International Monetary Fund, Balance of Payments Statistics Yearbook and data files.
Kategorien:
Economy & Growth, Trade
Es wurde aktualisiert:
23 Apr 2017 Jahr
Kennzahlen der Wertänderungen vom Jahr zum Jahr
im Durchschnitt:
38.502 Mlrd.
Minimum:
5.674 Mlrd.
1 Jan 1977 Jahr
Maximum:
119.07 Mlrd.
1 Jan 2009 Jahr
Zum Datum der Beobachtung
Wert
Absolute Veränderung
Die Veränderung bezüglich dem vorherigen Wert
1 Jan 1977 Jahr
5.674 Mlrd.
+5.674 Mlrd.
0.0%
1 Jan 1978 Jahr
6.557 Mlrd.
+883.0 Mln.
15.56%
1 Jan 1979 Jahr
7.515 Mlrd.
+958.0 Mln.
14.61%
1 Jan 1980 Jahr
10.305 Mlrd.
+2.79 Mlrd.
37.13%
1 Jan 1981 Jahr
11.145 Mlrd.
+840.0 Mln.
8.15%
1 Jan 1982 Jahr
11.941 Mlrd.
+796.0 Mln.
7.14%
1 Jan 1983 Jahr
10.534 Mlrd.
-1.407 Mlrd.
-11.78%
1 Jan 1984 Jahr
9.86 Mlrd.
-674.0 Mln.
-6.4%
1 Jan 1985 Jahr
9.957 Mlrd.
+97.0 Mln.
0.98%
1 Jan 1986 Jahr
10.771 Mlrd.
+814.0 Mln.
8.18%
1 Jan 1987 Jahr
10.535 Mlrd.
-236.0 Mln.
-2.19%
1 Jan 1988 Jahr
12.86 Mlrd.
+2.325 Mlrd.
22.07%
1 Jan 1989 Jahr
14.206 Mlrd.
+1.346 Mlrd.
10.47%
1 Jan 1990 Jahr
15.816 Mlrd.
+1.61 Mlrd.
11.33%
1 Jan 1991 Jahr
19.564 Mlrd.
+3.748 Mlrd.
23.7%
1 Jan 1992 Jahr
20.126 Mlrd.
+562.05 Mln.
2.87%
1 Jan 1993 Jahr
21.338 Mlrd.
+1.212 Mlrd.
6.02%
1 Jan 1994 Jahr
19.132 Mlrd.
-2.206 Mlrd.
-10.34%
1 Jan 1995 Jahr
20.385 Mlrd.
+1.253 Mlrd.
6.55%
1 Jan 1996 Jahr
24.711 Mlrd.
+4.326 Mlrd.
21.22%
1 Jan 1997 Jahr
25.633 Mlrd.
+922.0 Mln.
3.73%
1 Jan 1998 Jahr
25.601 Mlrd.
-32.0 Mln.
-0.12%
1 Jan 2000 Jahr
35.691 Mlrd.
+10.09 Mlrd.
39.41%
1 Jan 2001 Jahr
41.692 Mlrd.
+6.001 Mlrd.
16.81%
1 Jan 2002 Jahr
41.26 Mlrd.
-431.97 Mln.
-1.04%
1 Jan 2003 Jahr
41.112 Mlrd.
-147.408 Mln.
-0.36%
1 Jan 2004 Jahr
49.414 Mlrd.
+8.301 Mlrd.
20.19%
1 Jan 2005 Jahr
61.364 Mlrd.
+11.95 Mlrd.
24.18%
1 Jan 2006 Jahr
66.618 Mlrd.
+5.254 Mlrd.
8.56%
1 Jan 2007 Jahr
80.92 Mlrd.
+14.302 Mlrd.
21.47%
1 Jan 2008 Jahr
101.28 Mlrd.
+20.36 Mlrd.
25.16%
1 Jan 2009 Jahr
119.07 Mlrd.
+17.79 Mlrd.
17.56%
1 Jan 2010 Jahr
84.078 Mlrd.
-34.992 Mlrd.
-29.39%
1 Jan 2011 Jahr
80.176 Mlrd.
-3.902 Mlrd.
-4.64%
1 Jan 2012 Jahr
84.961 Mlrd.
+4.785 Mlrd.
5.97%
1 Jan 2013 Jahr
69.235 Mlrd.
-15.727 Mlrd.
-18.51%
1 Jan 2014 Jahr
79.647 Mlrd.
+10.412 Mlrd.
15.04%
1 Jan 2015 Jahr
82.074 Mlrd.
+2.427 Mlrd.
3.05%
1 Jan 2016 Jahr
58.806 Mlrd.
-23.268 Mlrd.
-28.35%
Bewertung der Länder gemäß mit laufender Statistik nach Jahren


Kommentare: