Download This statistics in other country:
Timeline:
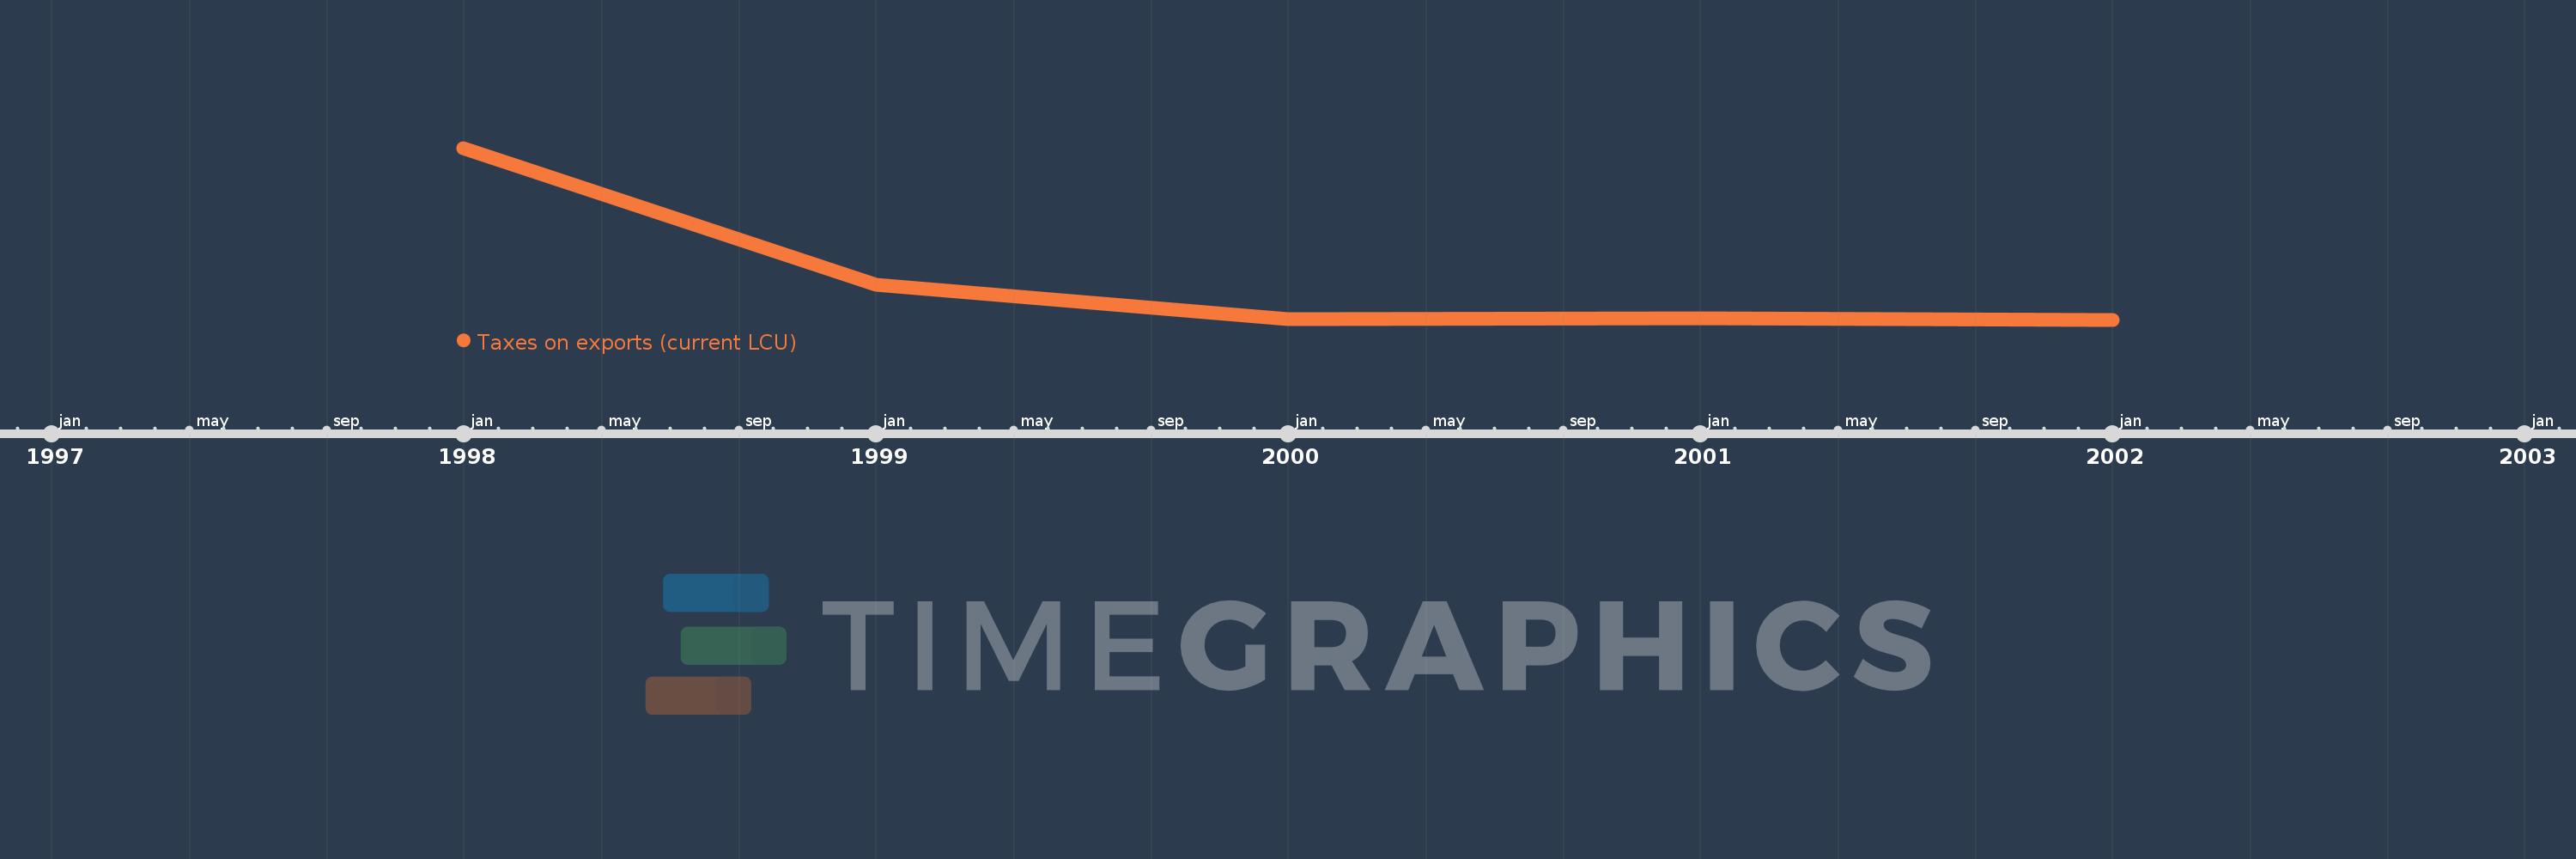
This timeline shows a graph from 1998 to 2002 of Bulgaria. No data until 1997. Number of actual observations by date: 5.
Source name:
World Development Indicators
Source organization:
International Monetary Fund, Government Finance Statistics Yearbook and data files.
Categories, topics:
Public Sector
Last updated:
apr 23, 2017
Indicators value changes by year
Maximum:
12.222 mln
jan 1, 1998
At the date of observation
Value
Absolute change
Change from the previous value
jan 1, 1998
12.222 mln
+12.222 mln
0.0%
jan 1, 1999
2.51 mln
-9.712 mln
-79.46%
jan 1, 2000
68.0K
-2.442 mln
-97.29%
jan 1, 2001
99.09K
+31.09K
45.72%
jan 1, 2002
14.6K
-84.49K
-85.27%
Ranking of countries by current statistics by years