Download This statistics in other country:
Timeline:
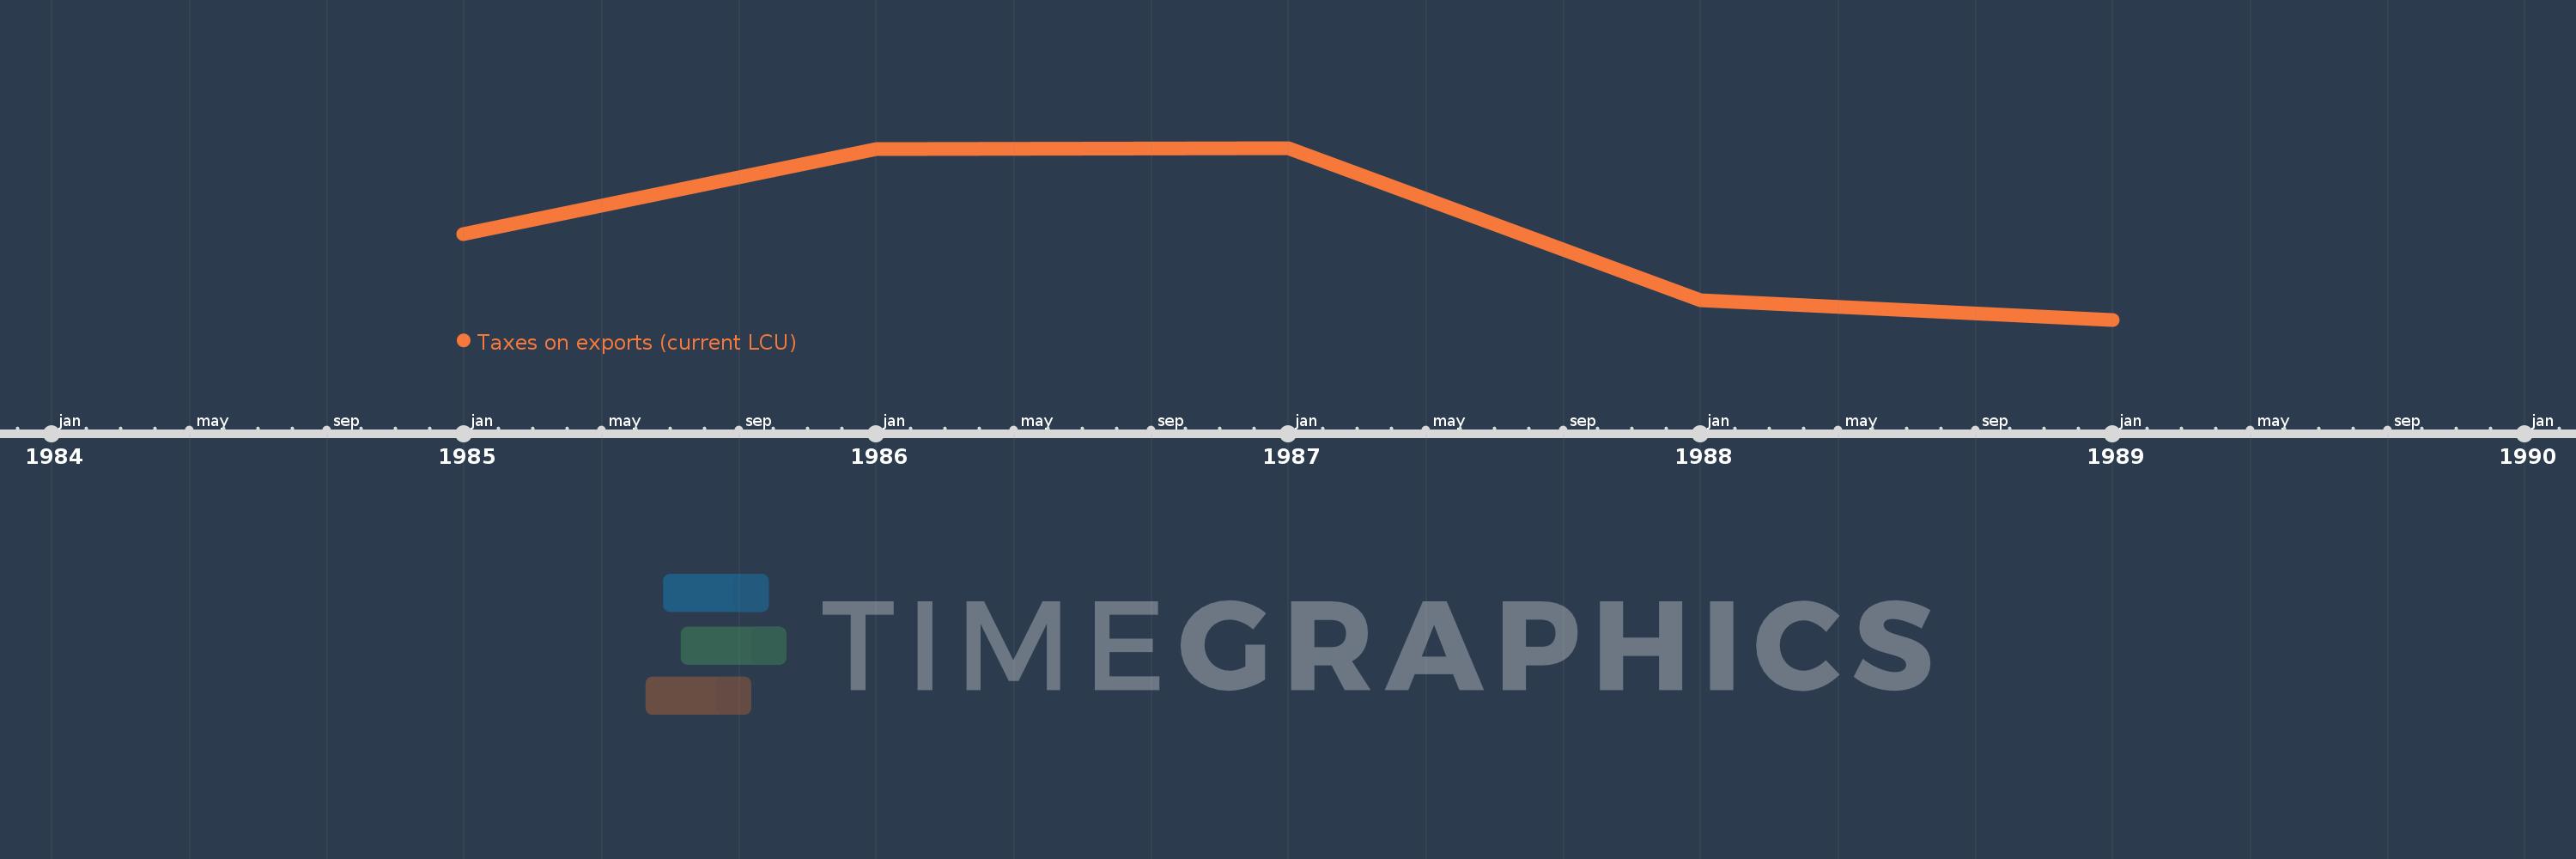
This timeline shows a graph from 1985 to 1989 of Poland. No data until 1984. Number of actual observations by date: 5.
Source name:
World Development Indicators
Source organization:
International Monetary Fund, Government Finance Statistics Yearbook and data files.
Categories, topics:
Public Sector
Last updated:
apr 23, 2017
Indicators value changes by year
Minimum:
3.33 mln
jan 1, 1989
Maximum:
10.24 mln
jan 1, 1987
At the date of observation
Value
Absolute change
Change from the previous value
jan 1, 1985
6.78 mln
+6.78 mln
0.0%
jan 1, 1986
10.19 mln
+3.41 mln
50.29%
jan 1, 1987
10.24 mln
+50.0K
0.49%
jan 1, 1988
4.1 mln
-6.14 mln
-59.96%
jan 1, 1989
3.33 mln
-770.0K
-18.78%
Ranking of countries by current statistics by years