Download This statistics in other country:
Timeline:
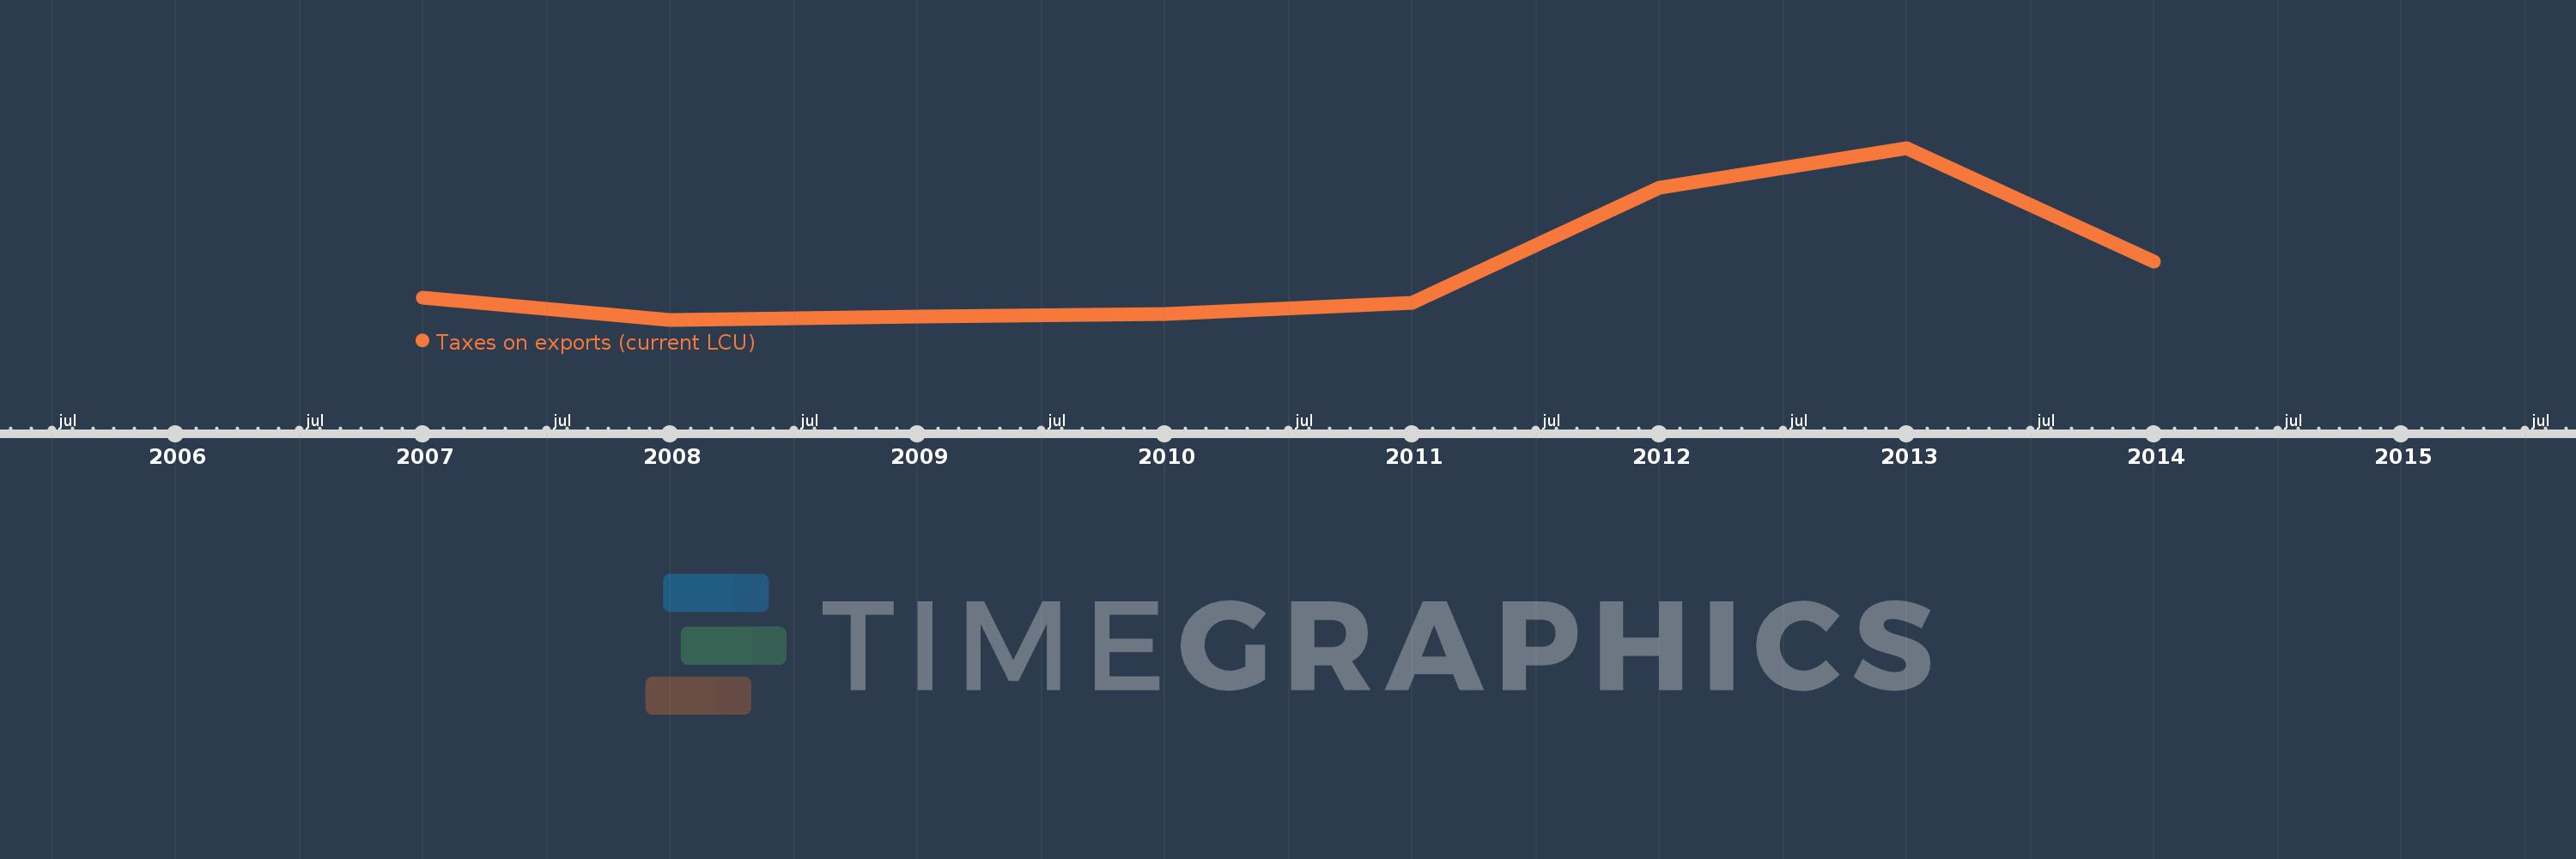
This timeline shows a graph from 2007 to 2014 of Afghanistan. No data until 2006. Number of actual observations by date: 8.
Source name:
World Development Indicators
Source organization:
International Monetary Fund, Government Finance Statistics Yearbook and data files.
Categories, topics:
Public Sector
Last updated:
apr 23, 2017
Indicators value changes by year
Minimum:
3.505 mln
jan 1, 2008
Maximum:
164.578 mln
jan 1, 2013
At the date of observation
Value
Absolute change
Change from the previous value
jan 1, 2007
24.429 mln
+24.429 mln
0.0%
jan 1, 2008
3.505 mln
-20.924 mln
-85.65%
jan 1, 2009
6.086 mln
+2.581 mln
73.66%
jan 1, 2010
9.025 mln
+2.939 mln
48.29%
jan 1, 2011
19.625 mln
+10.6 mln
117.45%
jan 1, 2012
127.643 mln
+108.017 mln
550.4%
jan 1, 2013
164.578 mln
+36.936 mln
28.94%
jan 1, 2014
58.036 mln
-106.542 mln
-64.74%
Ranking of countries by current statistics by years