Download This statistics in other country:
Timeline:
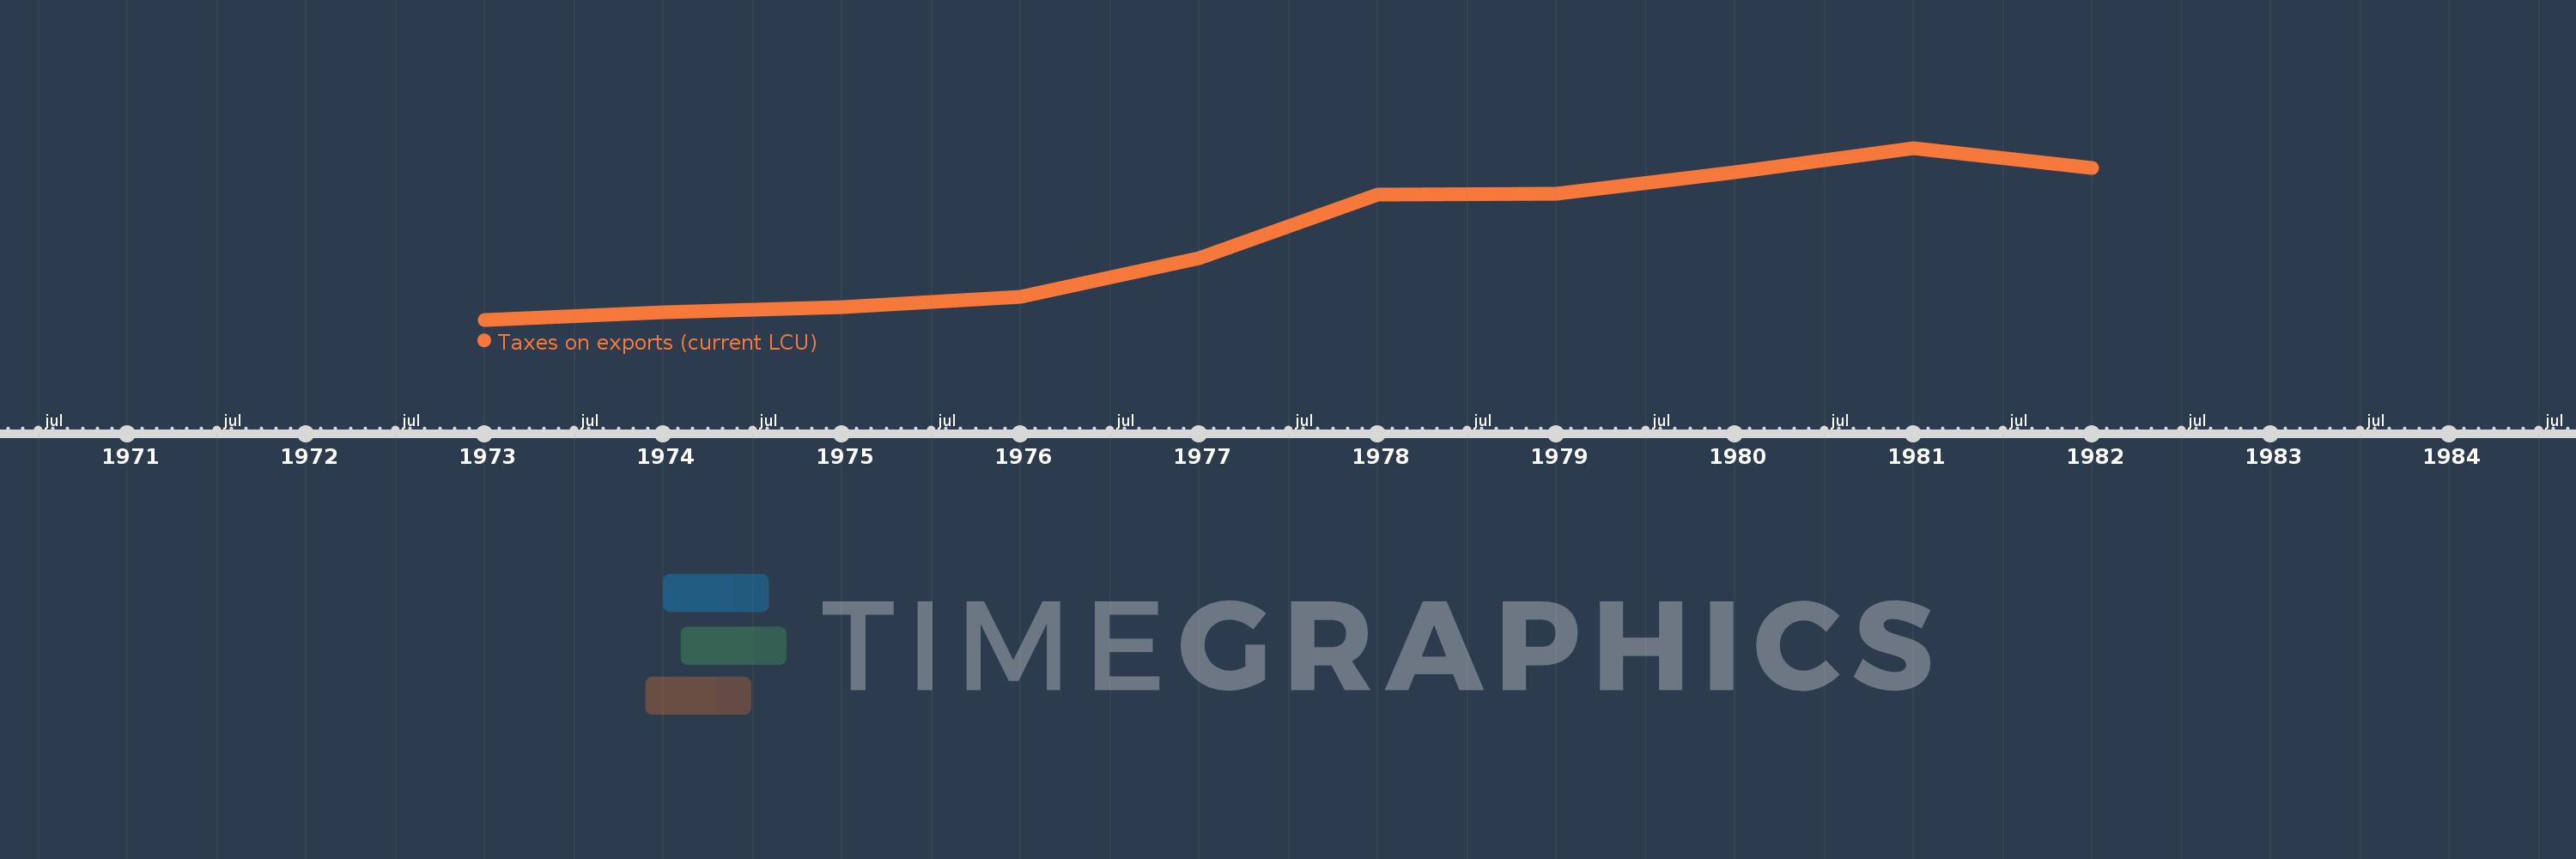
This timeline shows a graph from 1973 to 1982 of Honduras. No data until 1972. Number of actual observations by date: 10.
Source name:
World Development Indicators
Source organization:
International Monetary Fund, Government Finance Statistics Yearbook and data files.
Categories, topics:
Public Sector
Last updated:
apr 23, 2017
Indicators value changes by year
Minimum:
6.0 mln
jan 1, 1973
Maximum:
128.3 mln
jan 1, 1981
At the date of observation
Value
Absolute change
Change from the previous value
jan 1, 1973
6.0 mln
+6.0 mln
0.0%
jan 1, 1974
11.4 mln
+5.4 mln
90.0%
jan 1, 1975
14.8 mln
+3.4 mln
29.82%
jan 1, 1976
22.3 mln
+7.5 mln
50.68%
jan 1, 1977
50.0 mln
+27.7 mln
124.22%
jan 1, 1978
95.2 mln
+45.2 mln
90.4%
jan 1, 1979
95.5 mln
+300.0K
0.32%
jan 1, 1980
110.7 mln
+15.2 mln
15.92%
jan 1, 1981
128.3 mln
+17.6 mln
15.9%
jan 1, 1982
113.9 mln
-14.4 mln
-11.22%
Ranking of countries by current statistics by years