33
/
AIzaSyB4mHJ5NPEv-XzF7P6NDYXjlkCWaeKw5bc
November 30, 2025
125585
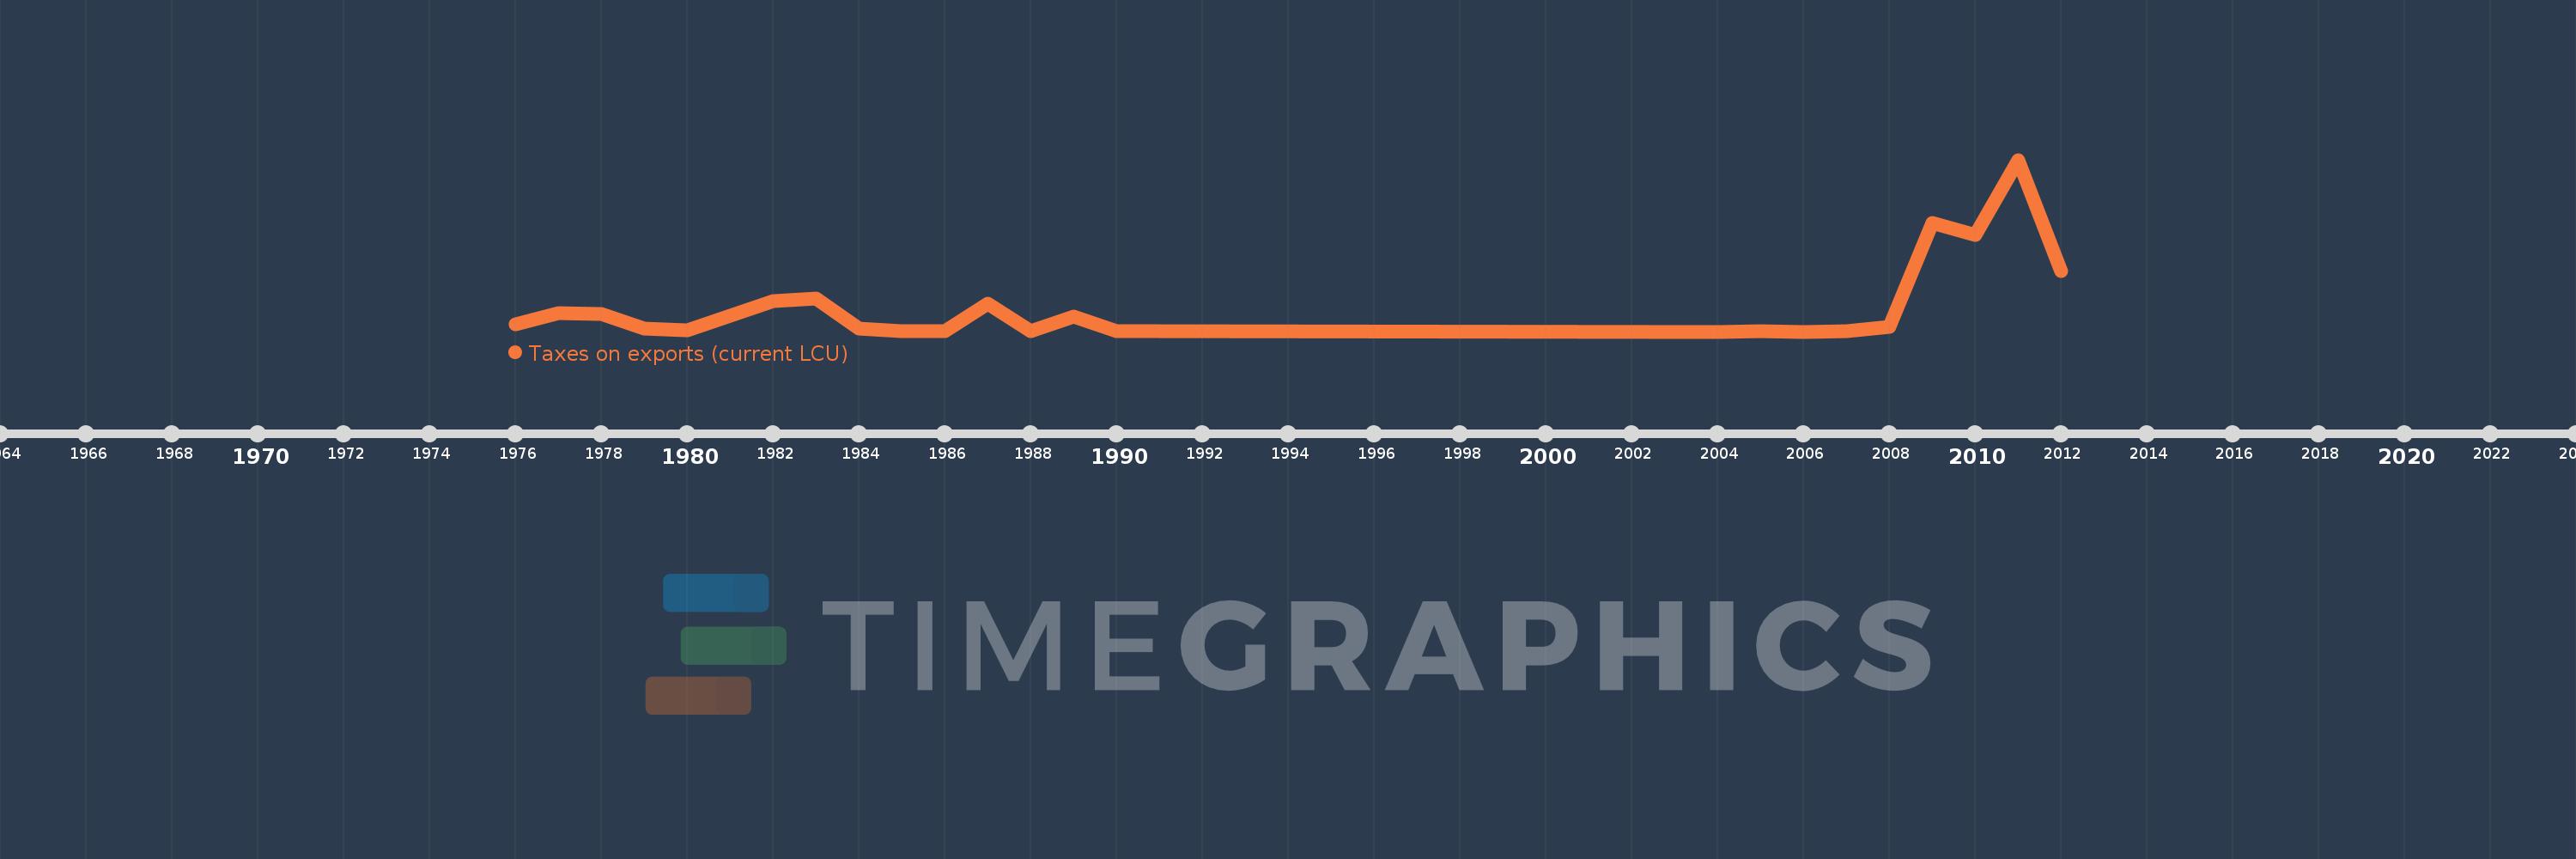
Egypt, Arab Rep.
EGY
true
2
1
Taxes on exports (current LCU)
2012,2011,2010,2009,2008,2007,2006,2005,2004,1991,1990,1989,1988,1987,1986,1985,1984,1983,1982,1980,1979,1978,1977,1976