Download This statistics in other country:
Timeline:
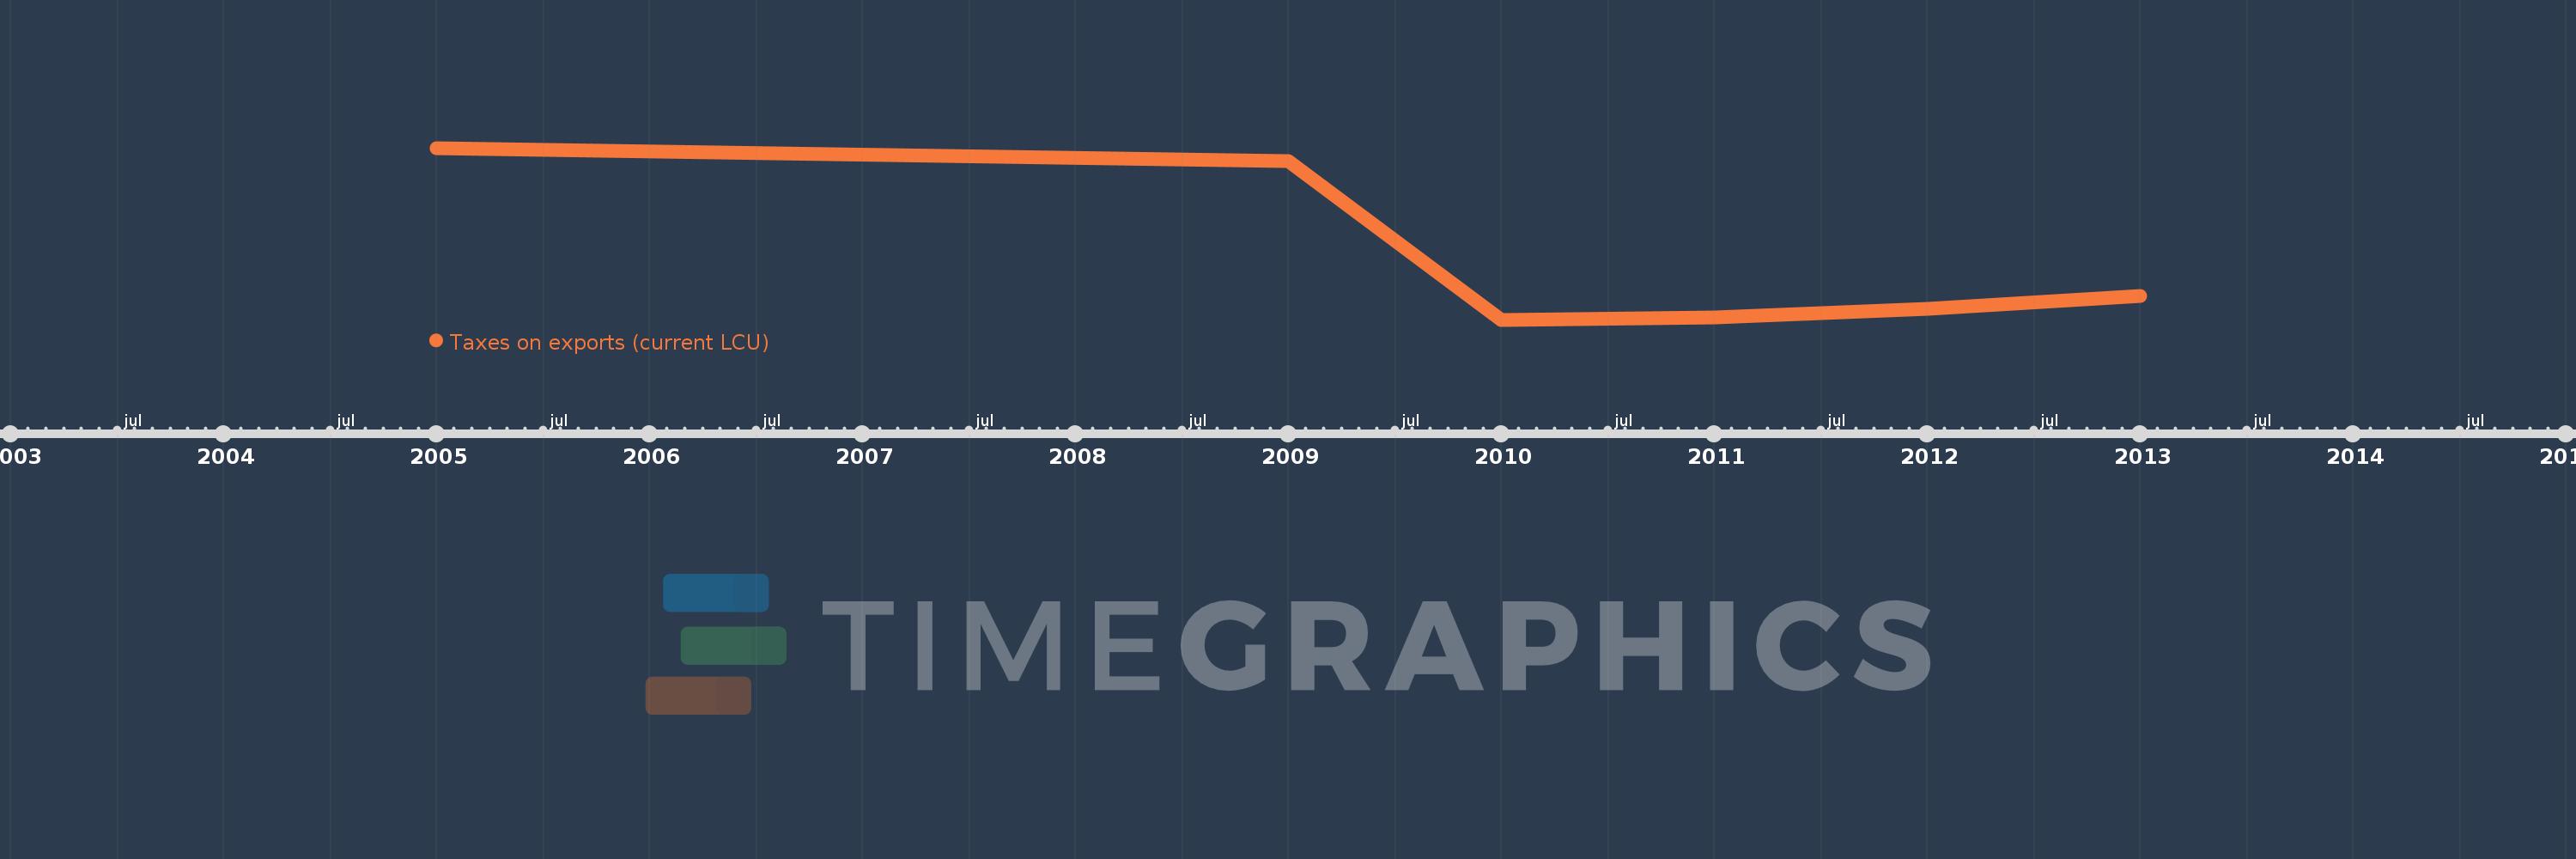
This timeline shows a graph from 2005 to 2013 of Central African Republic. No data until 2004. Number of actual observations by date: 6.
Source name:
World Development Indicators
Source organization:
International Monetary Fund, Government Finance Statistics Yearbook and data files.
Categories, topics:
Public Sector
Last updated:
apr 23, 2017
Indicators value changes by year
Minimum:
2.03 bln
jan 1, 2010
Maximum:
3.459 bln
jan 1, 2005
At the date of observation
Value
Absolute change
Change from the previous value
jan 1, 2005
3.459 bln
+3.459 bln
0.0%
jan 1, 2009
3.347 bln
-112.139 mln
-3.24%
jan 1, 2010
2.03 bln
-1.317 bln
-39.35%
jan 1, 2011
2.047 bln
+17.141 mln
0.84%
jan 1, 2012
2.123 bln
+75.883 mln
3.71%
jan 1, 2013
2.226 bln
+102.806 mln
4.84%
Ranking of countries by current statistics by years