Download This statistics in other country:
Timeline:
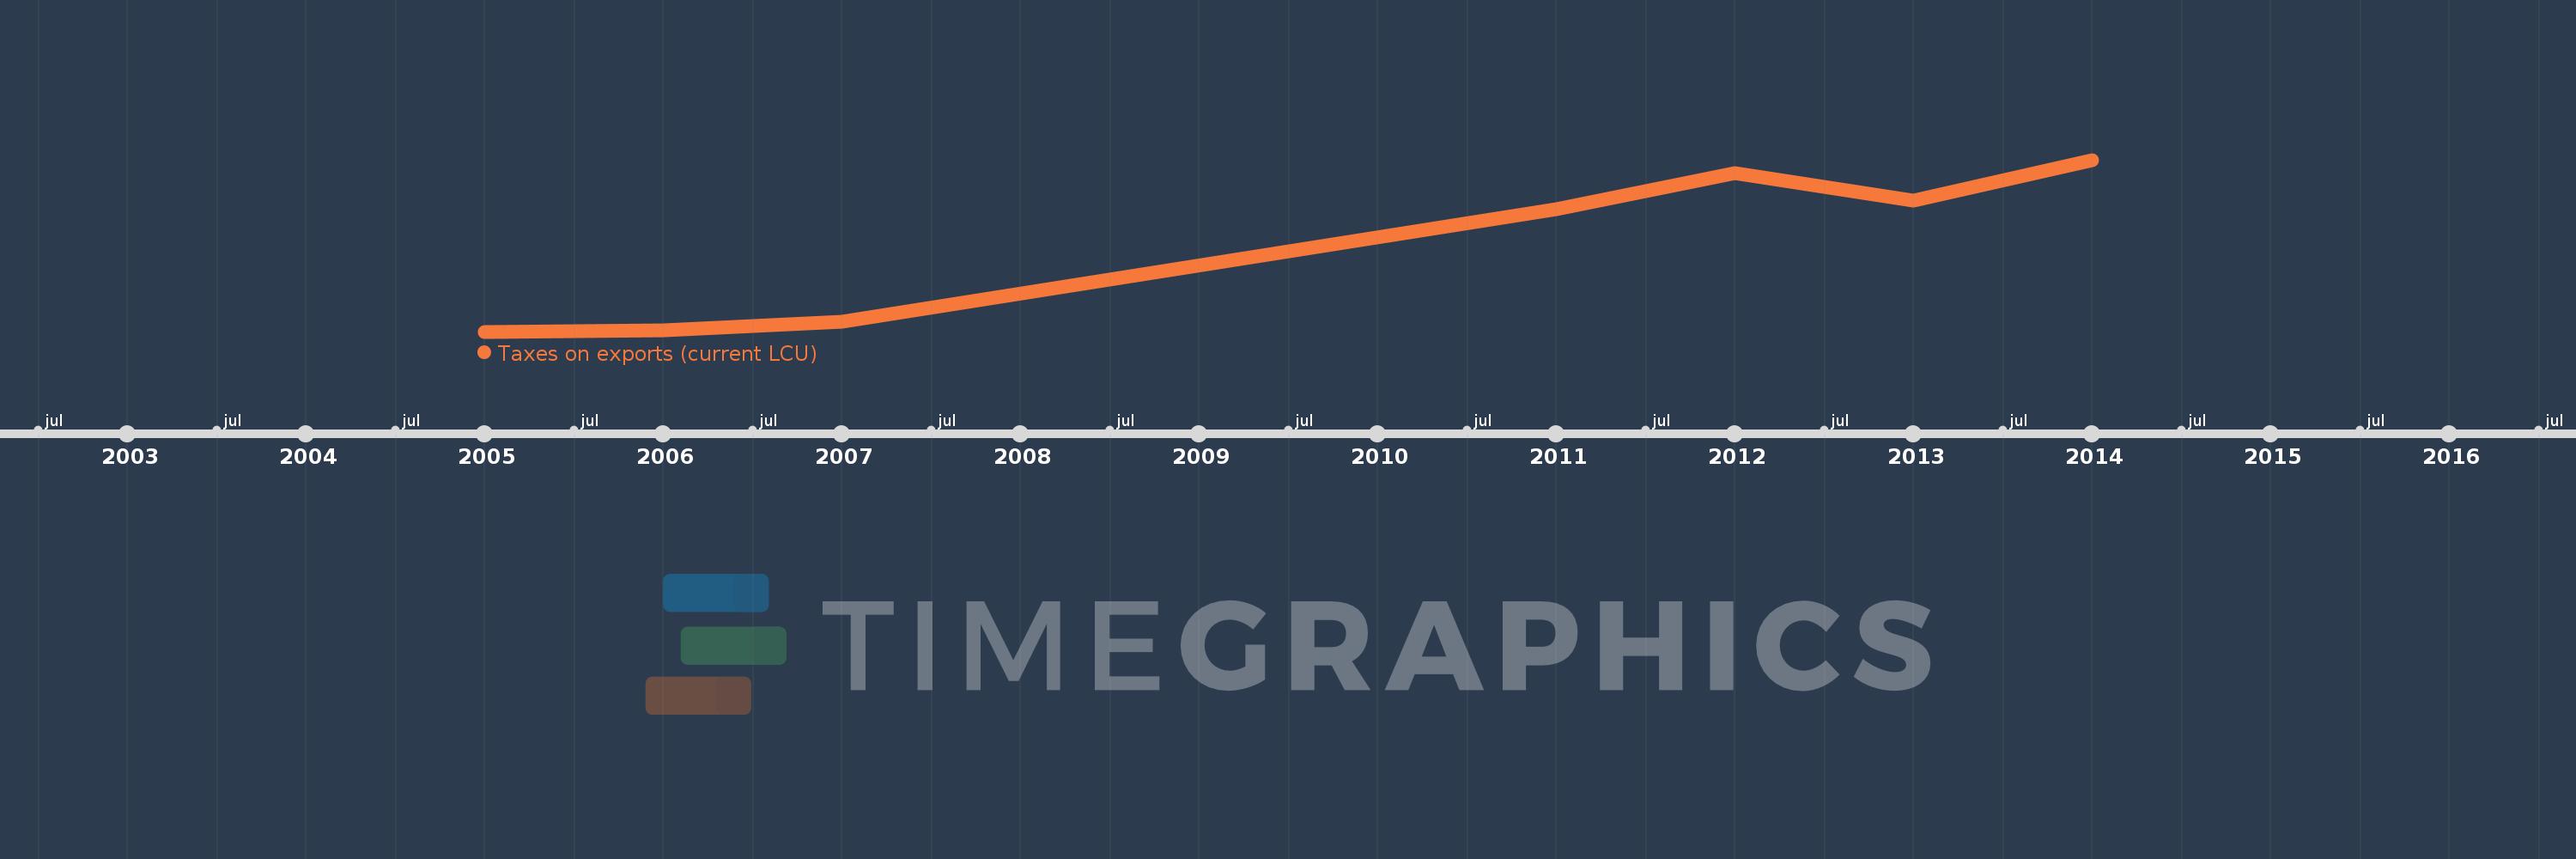
This timeline shows a graph from 2005 to 2014 of Togo. No data until 2004. Number of actual observations by date: 7.
Source name:
World Development Indicators
Source organization:
International Monetary Fund, Government Finance Statistics Yearbook and data files.
Categories, topics:
Public Sector
Last updated:
apr 23, 2017
Indicators value changes by year
Minimum:
300.0 mln
jan 1, 2005
Maximum:
1.881 bln
jan 1, 2014
At the date of observation
Value
Absolute change
Change from the previous value
jan 1, 2005
300.0 mln
+300.0 mln
0.0%
jan 1, 2006
313.82 mln
+13.82 mln
4.61%
jan 1, 2007
391.455 mln
+77.635 mln
24.74%
jan 1, 2011
1.43 bln
+1.038 bln
265.22%
jan 1, 2012
1.76 bln
+330.327 mln
23.11%
jan 1, 2013
1.506 bln
-254.494 mln
-14.46%
jan 1, 2014
1.881 bln
+375.329 mln
24.93%
Ranking of countries by current statistics by years