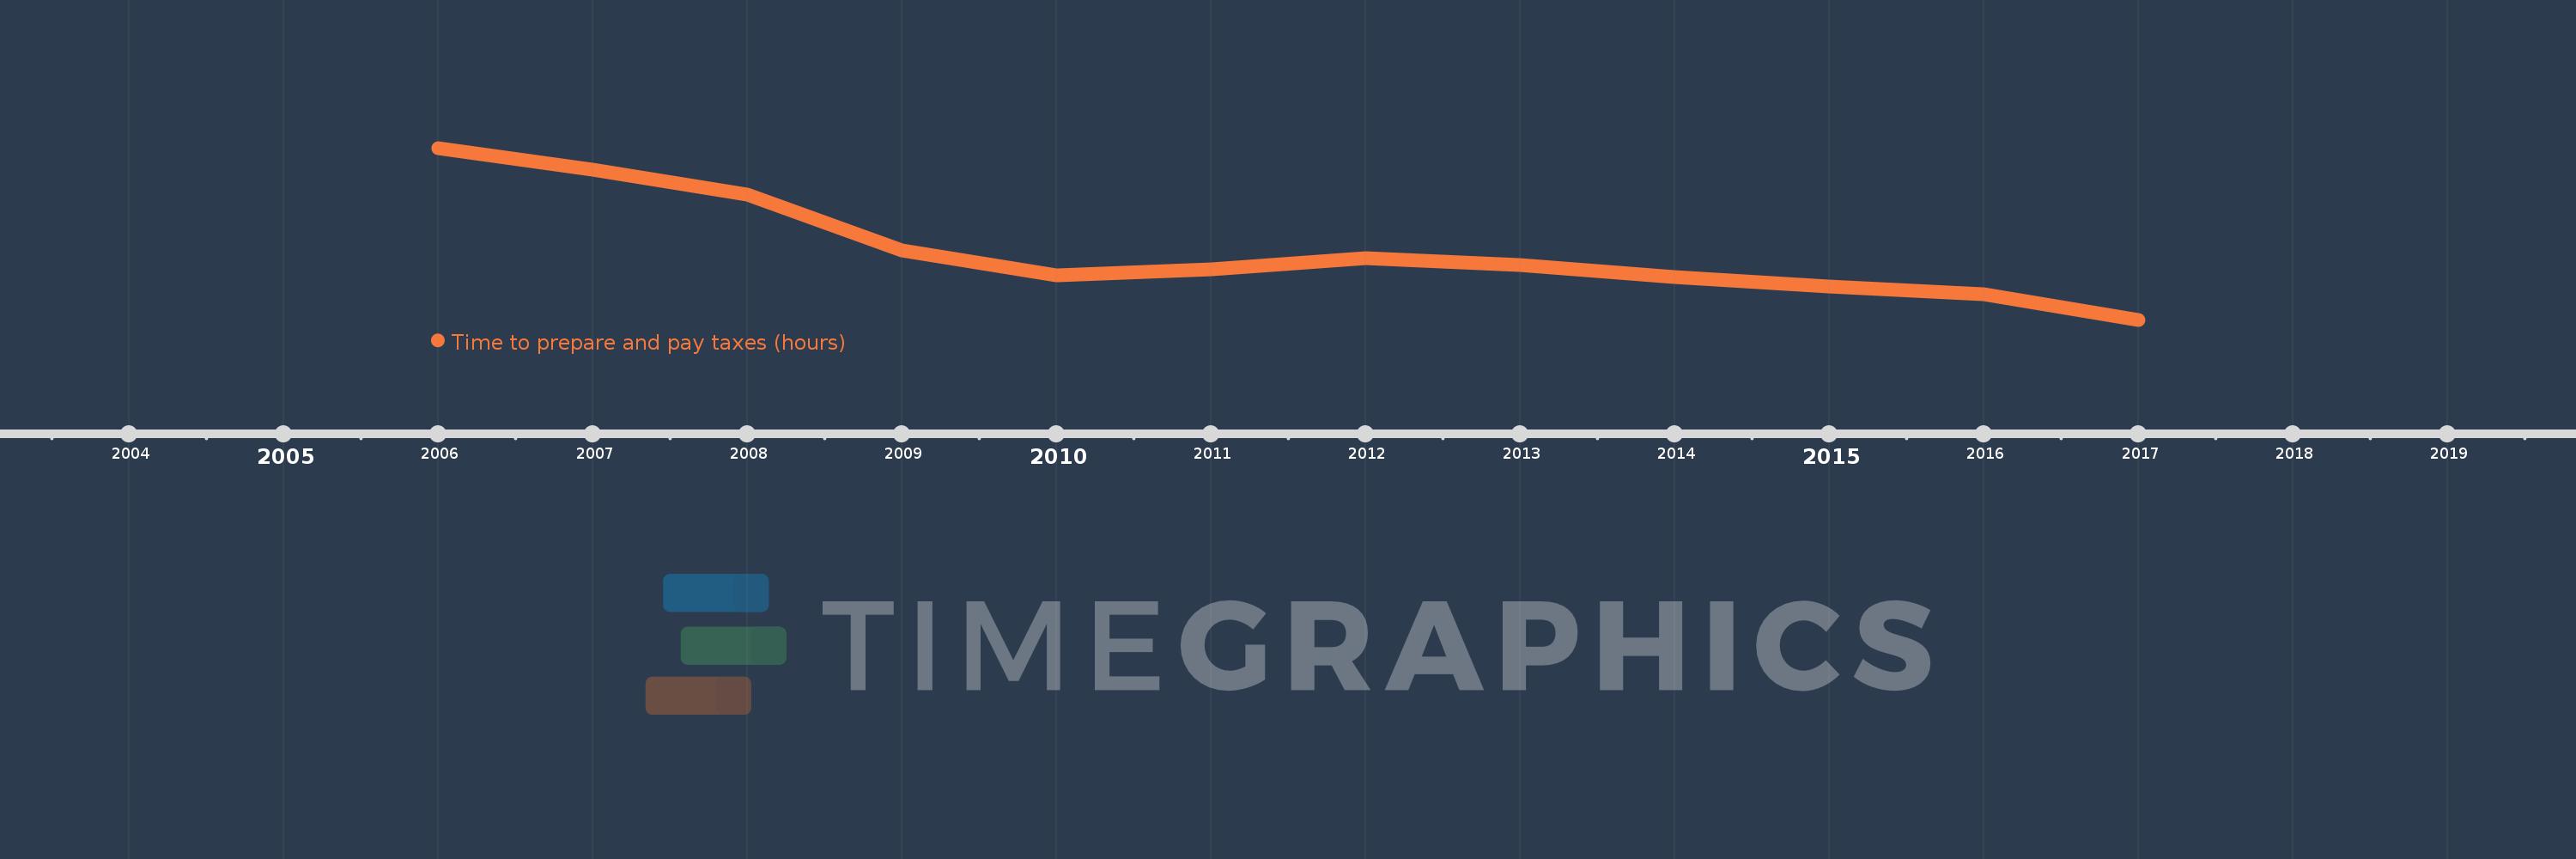
This timeline shows a graph from 2006 to 2017 of Sub-Saharan Africa (IDA & IBRD countries). No data until 2005. Number of actual observations by date: 12.
Source name:
World Development Indicators
Source organization:
World Bank, Doing Business project (http://www.doingbusiness.org/).
Categories, topics:
Private Sector, Public Sector
Last updated:
apr 23, 2017
Indicators value changes by year
Meaning:
319.941
Minimum:
304.232
jan 1, 2017
Maximum:
343.267
jan 1, 2006
At the date of observation
Value
Absolute change
Change from the previous value
jan 1, 2006
343.267
+343.267
0.0%
jan 1, 2007
338.283
-4.984
-1.45%
jan 1, 2008
332.587
-5.696
-1.68%
jan 1, 2009
320.065
-12.522
-3.76%
jan 1, 2010
314.391
-5.674
-1.77%
jan 1, 2011
315.637
+1.246
0.4%
jan 1, 2012
318.207
+2.57
0.81%
jan 1, 2013
316.745
-1.462
-0.46%
jan 1, 2014
313.998
-2.747
-0.87%
jan 1, 2015
311.828
-2.17
-0.69%
jan 1, 2016
310.051
-1.777
-0.57%
jan 1, 2017
304.232
-5.819
-1.88%
Ranking of countries by current statistics by years