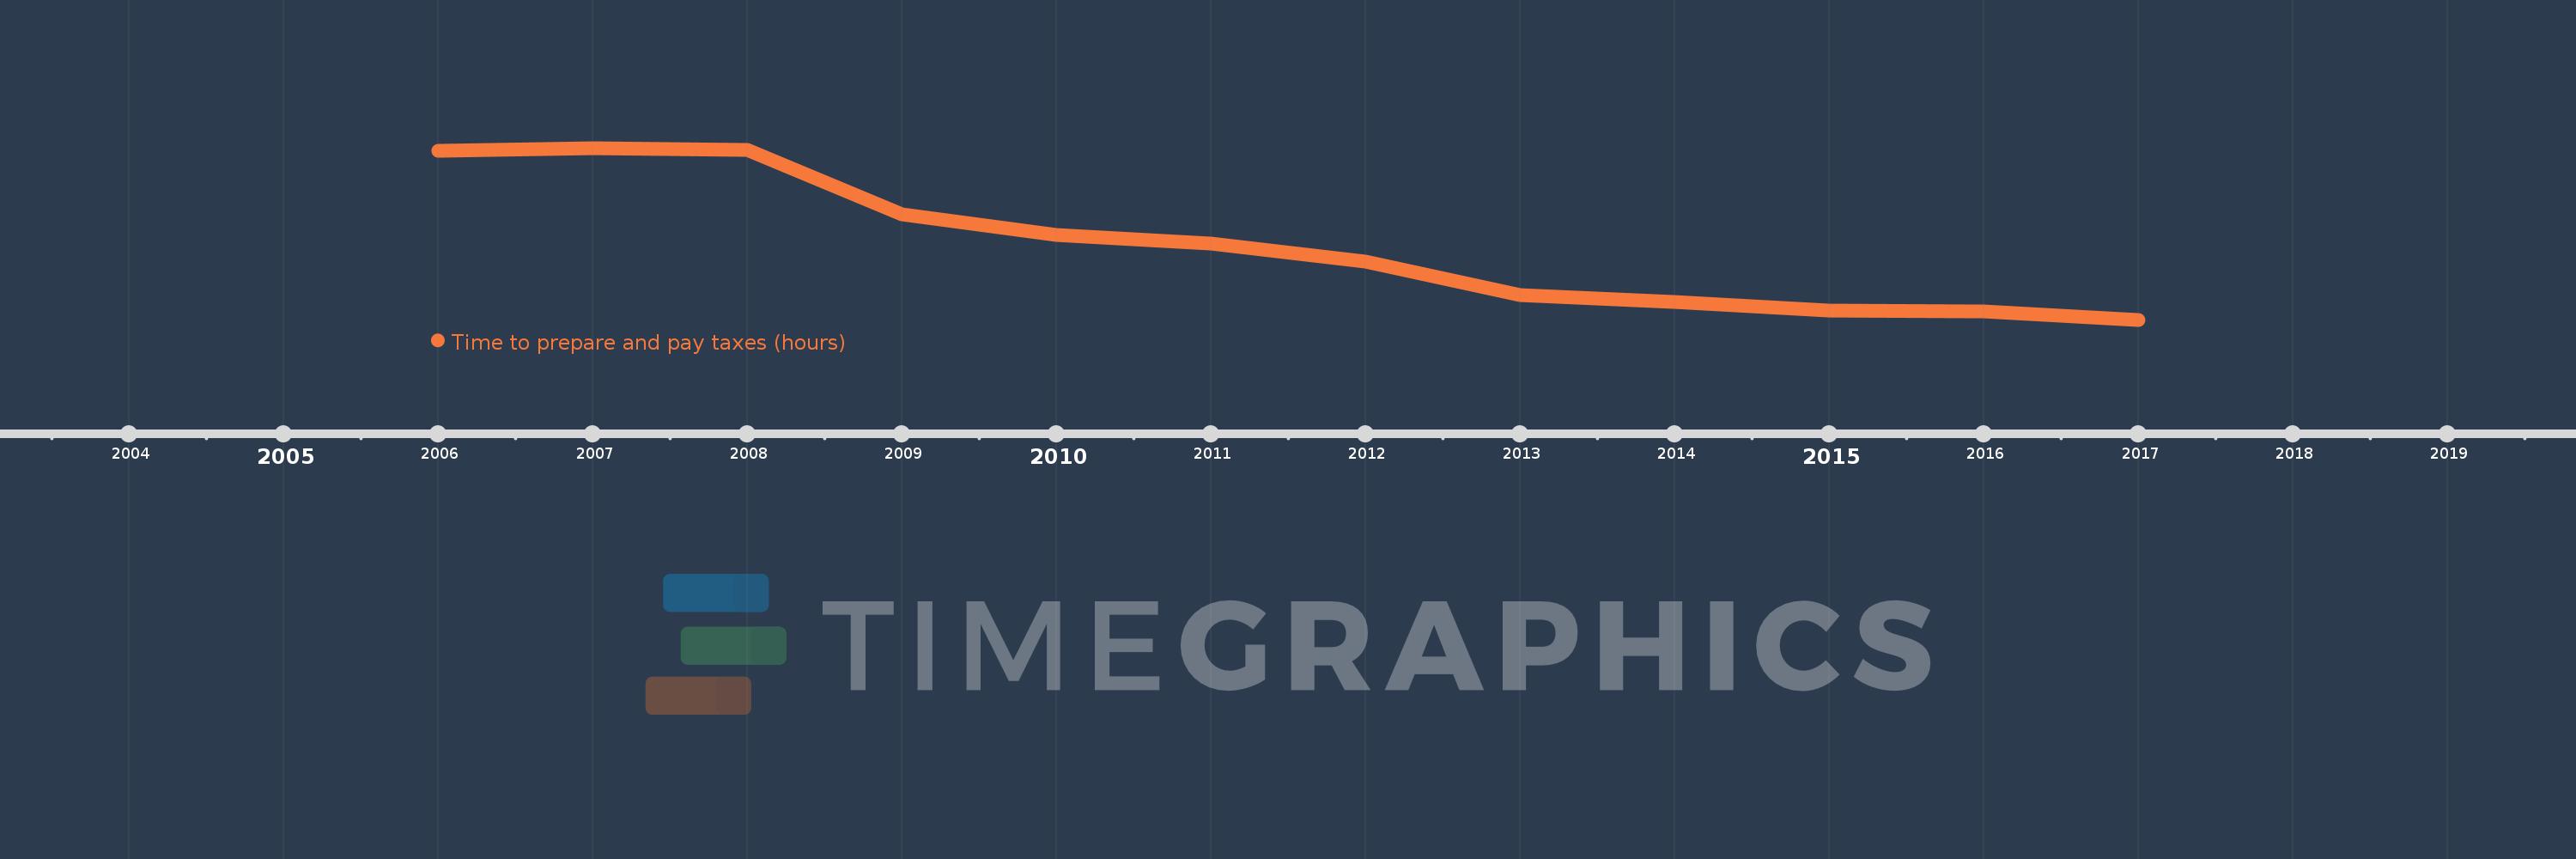
This timeline shows a graph from 2006 to 2017 of Europe & Central Asia (excluding high income). No data until 2005. Number of actual observations by date: 12.
Source name:
World Development Indicators
Source organization:
World Bank, Doing Business project (http://www.doingbusiness.org/).
Categories, topics:
Private Sector, Public Sector
Last updated:
apr 23, 2017
Indicators value changes by year
Meaning:
348.908
Minimum:
240.7
jan 1, 2017
Maximum:
489.553
jan 1, 2007
At the date of observation
Value
Absolute change
Change from the previous value
jan 1, 2006
485.861
+485.861
0.0%
jan 1, 2007
489.553
+3.692
0.76%
jan 1, 2008
486.289
-3.263
-0.67%
jan 1, 2009
393.142
-93.147
-19.15%
jan 1, 2010
364.11
-29.032
-7.38%
jan 1, 2011
351.05
-13.06
-3.59%
jan 1, 2012
325.35
-25.7
-7.32%
jan 1, 2013
276.0
-49.35
-15.17%
jan 1, 2014
267.075
-8.925
-3.23%
jan 1, 2015
254.425
-12.65
-4.74%
jan 1, 2016
253.34
-1.085
-0.43%
jan 1, 2017
240.7
-12.64
-4.99%
Ranking of countries by current statistics by years