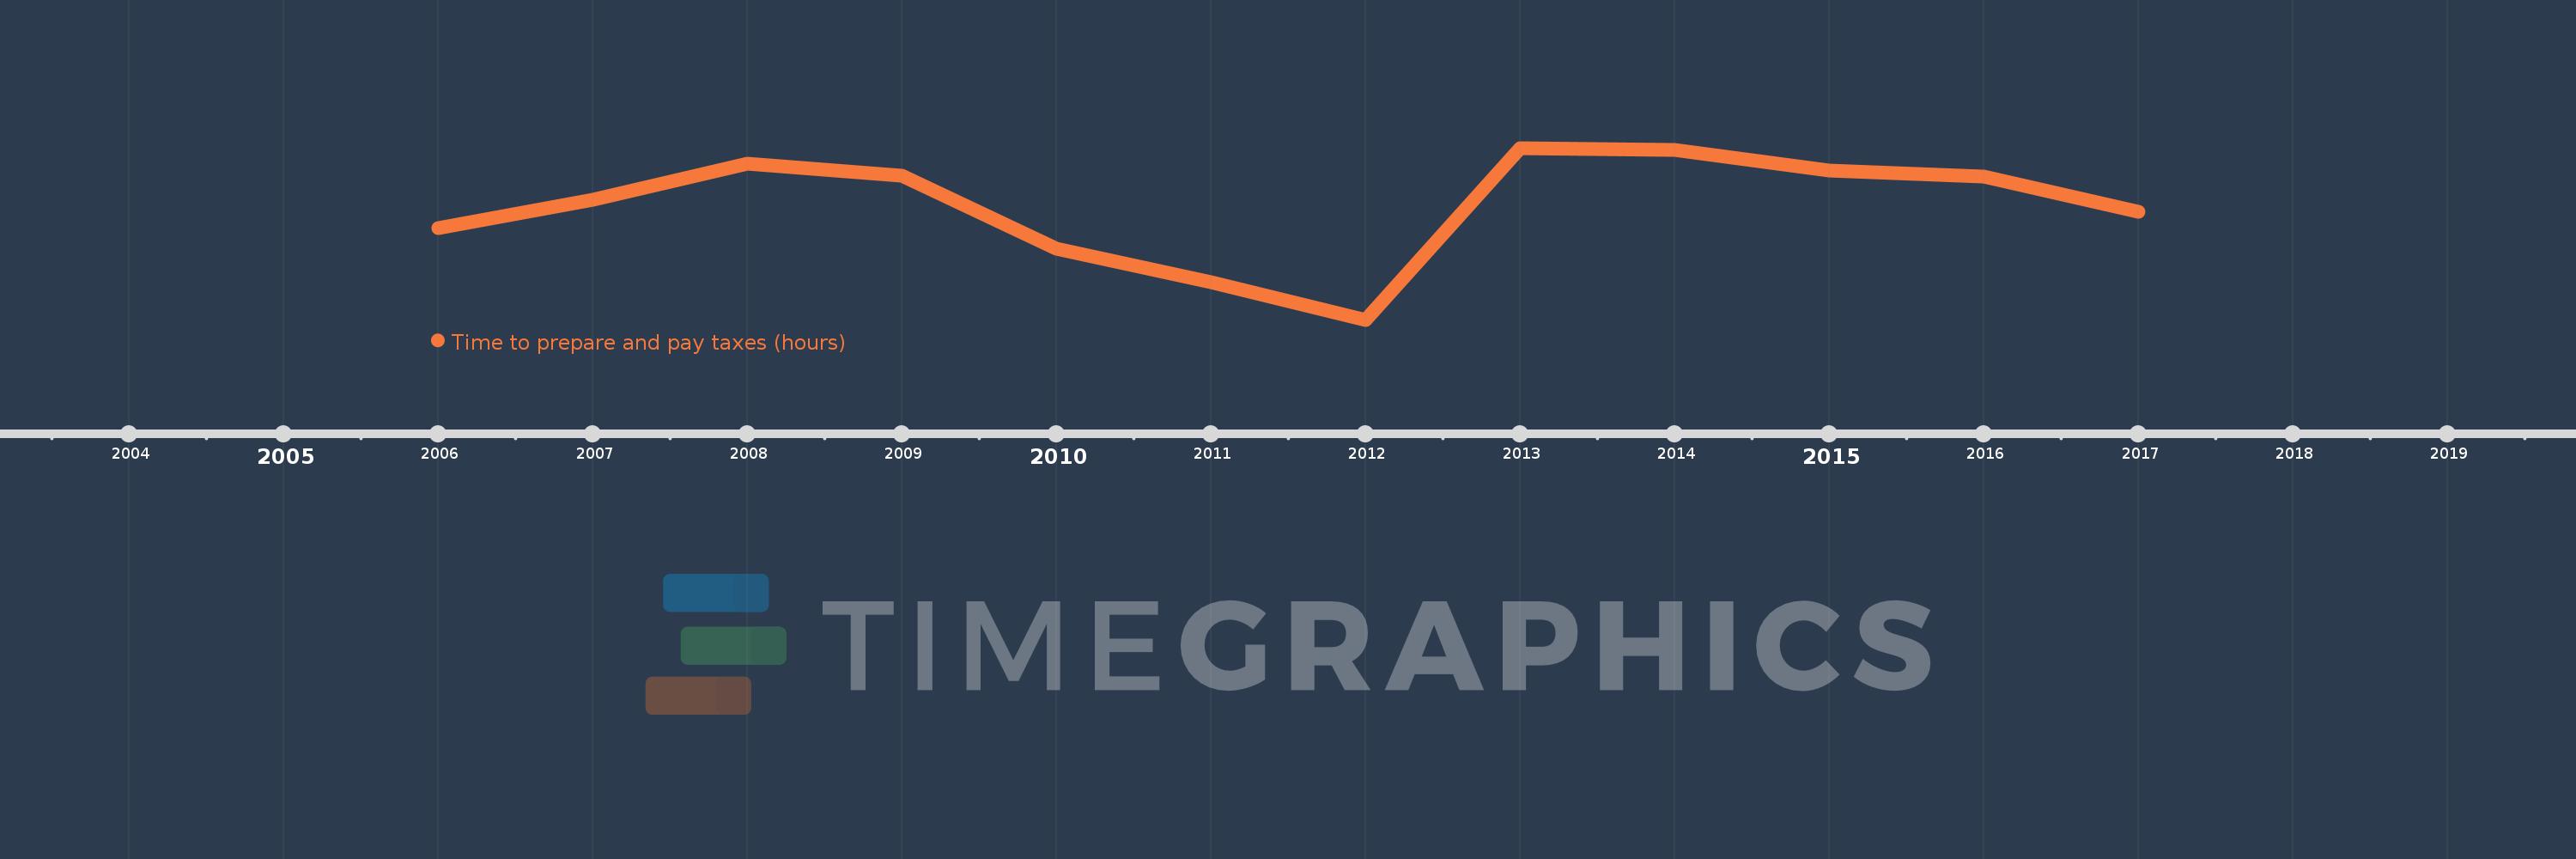
This timeline shows a graph from 2006 to 2017 of Middle East & North Africa (excluding high income). No data until 2005. Number of actual observations by date: 12.
Source name:
World Development Indicators
Source organization:
World Bank, Doing Business project (http://www.doingbusiness.org/).
Categories, topics:
Private Sector, Public Sector
Last updated:
apr 23, 2017
Indicators value changes by year
Meaning:
286.975
Minimum:
256.917
jan 1, 2012
Maximum:
302.385
jan 1, 2013
At the date of observation
Value
Absolute change
Change from the previous value
jan 1, 2006
281.083
+281.083
0.0%
jan 1, 2007
288.708
+7.625
2.71%
jan 1, 2008
298.333
+9.625
3.33%
jan 1, 2009
295.0
-3.333
-1.12%
jan 1, 2010
275.75
-19.25
-6.53%
jan 1, 2011
266.833
-8.917
-3.23%
jan 1, 2012
256.917
-9.917
-3.72%
jan 1, 2013
302.385
+45.468
17.7%
jan 1, 2014
301.923
-0.462
-0.15%
jan 1, 2015
296.462
-5.462
-1.81%
jan 1, 2016
294.846
-1.615
-0.54%
jan 1, 2017
285.462
-9.385
-3.18%
Ranking of countries by current statistics by years