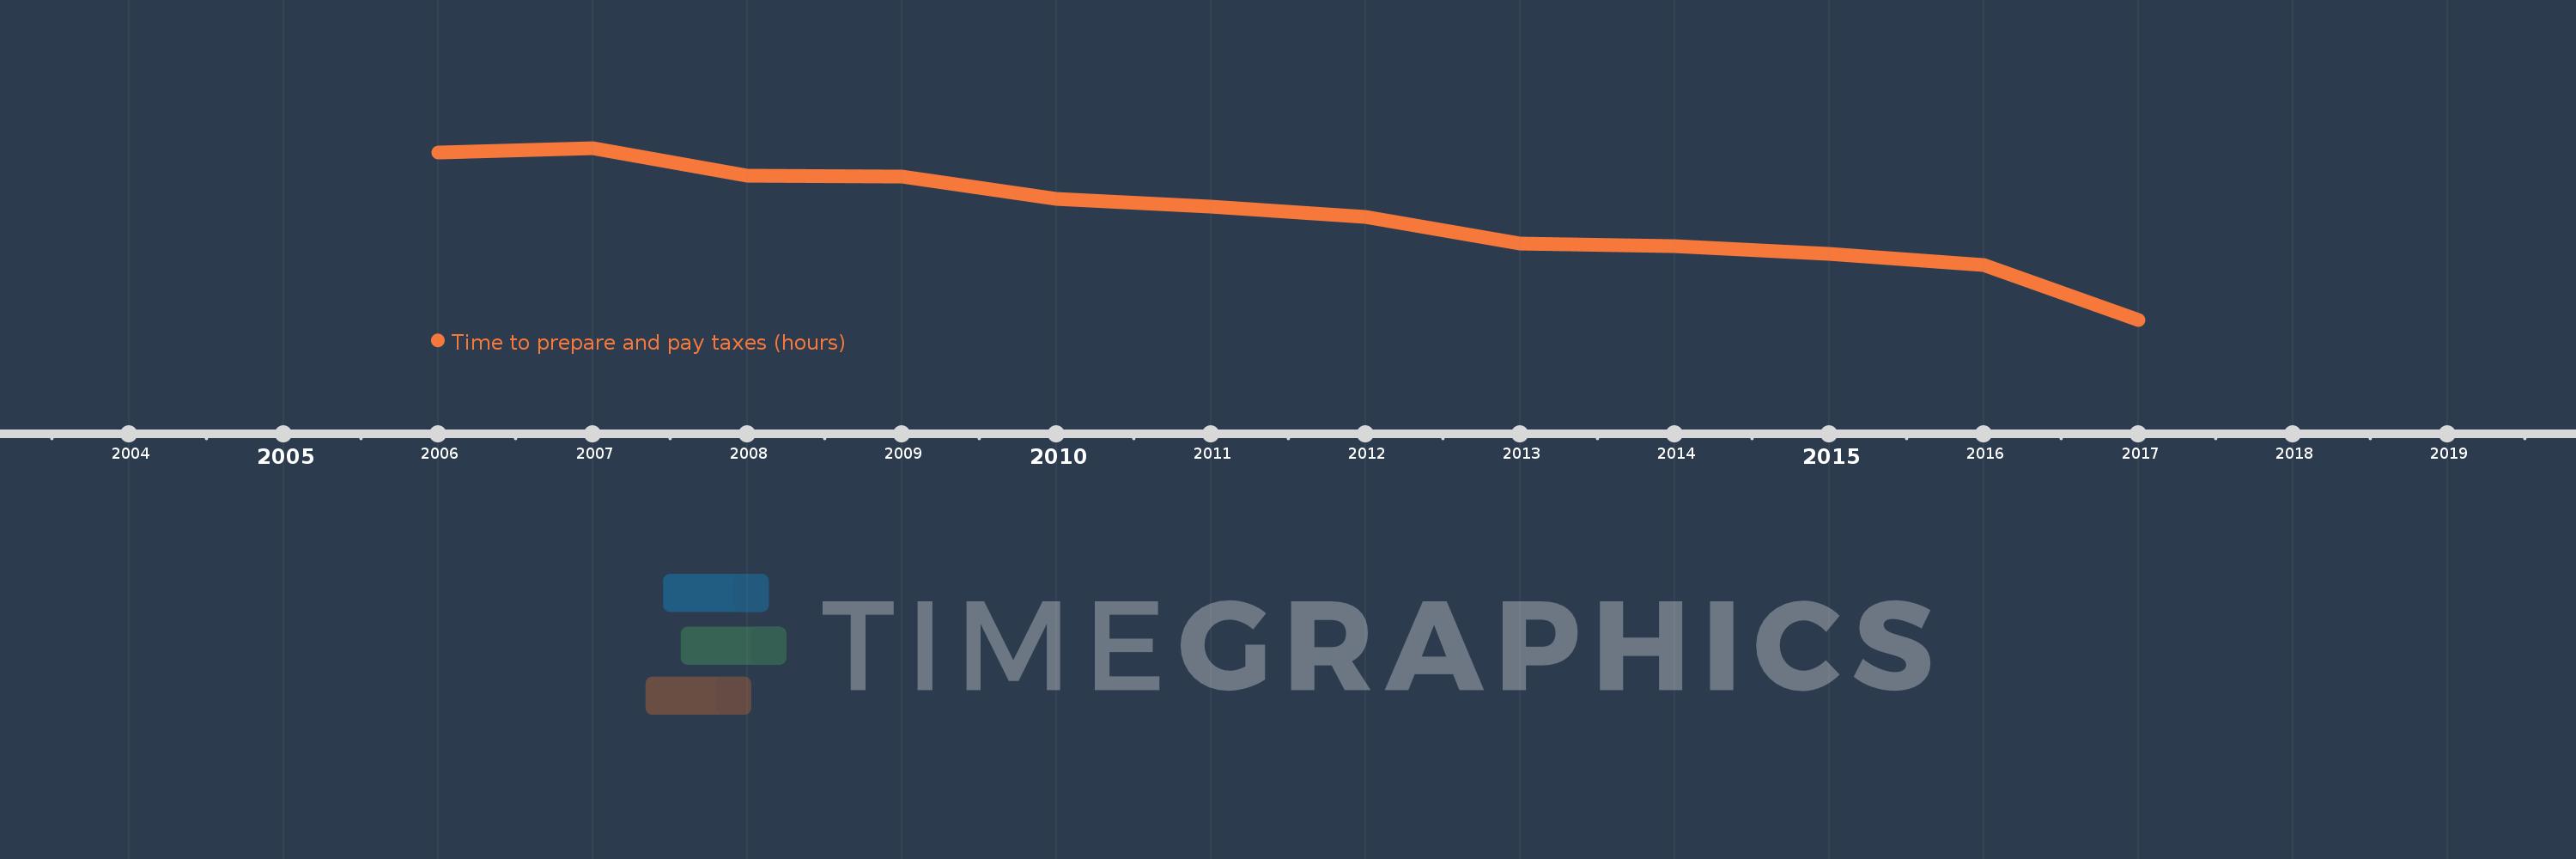
This timeline shows a graph from 2006 to 2017 of Latin America & the Caribbean (IDA & IBRD countries). No data until 2005. Number of actual observations by date: 12.
Source name:
World Development Indicators
Source organization:
World Bank, Doing Business project (http://www.doingbusiness.org/).
Categories, topics:
Private Sector, Public Sector
Last updated:
apr 23, 2017
Indicators value changes by year
Meaning:
394.822
Minimum:
352.2
jan 1, 2017
Maximum:
423.433
jan 1, 2007
At the date of observation
Value
Absolute change
Change from the previous value
jan 1, 2006
421.633
+421.633
0.0%
jan 1, 2007
423.433
+1.8
0.43%
jan 1, 2008
412.067
-11.367
-2.68%
jan 1, 2009
411.457
-0.61
-0.15%
jan 1, 2010
402.36
-9.097
-2.21%
jan 1, 2011
398.933
-3.427
-0.85%
jan 1, 2012
394.833
-4.1
-1.03%
jan 1, 2013
383.733
-11.1
-2.81%
jan 1, 2014
382.683
-1.05
-0.27%
jan 1, 2015
379.5
-3.183
-0.83%
jan 1, 2016
375.033
-4.467
-1.18%
jan 1, 2017
352.2
-22.833
-6.09%
Ranking of countries by current statistics by years