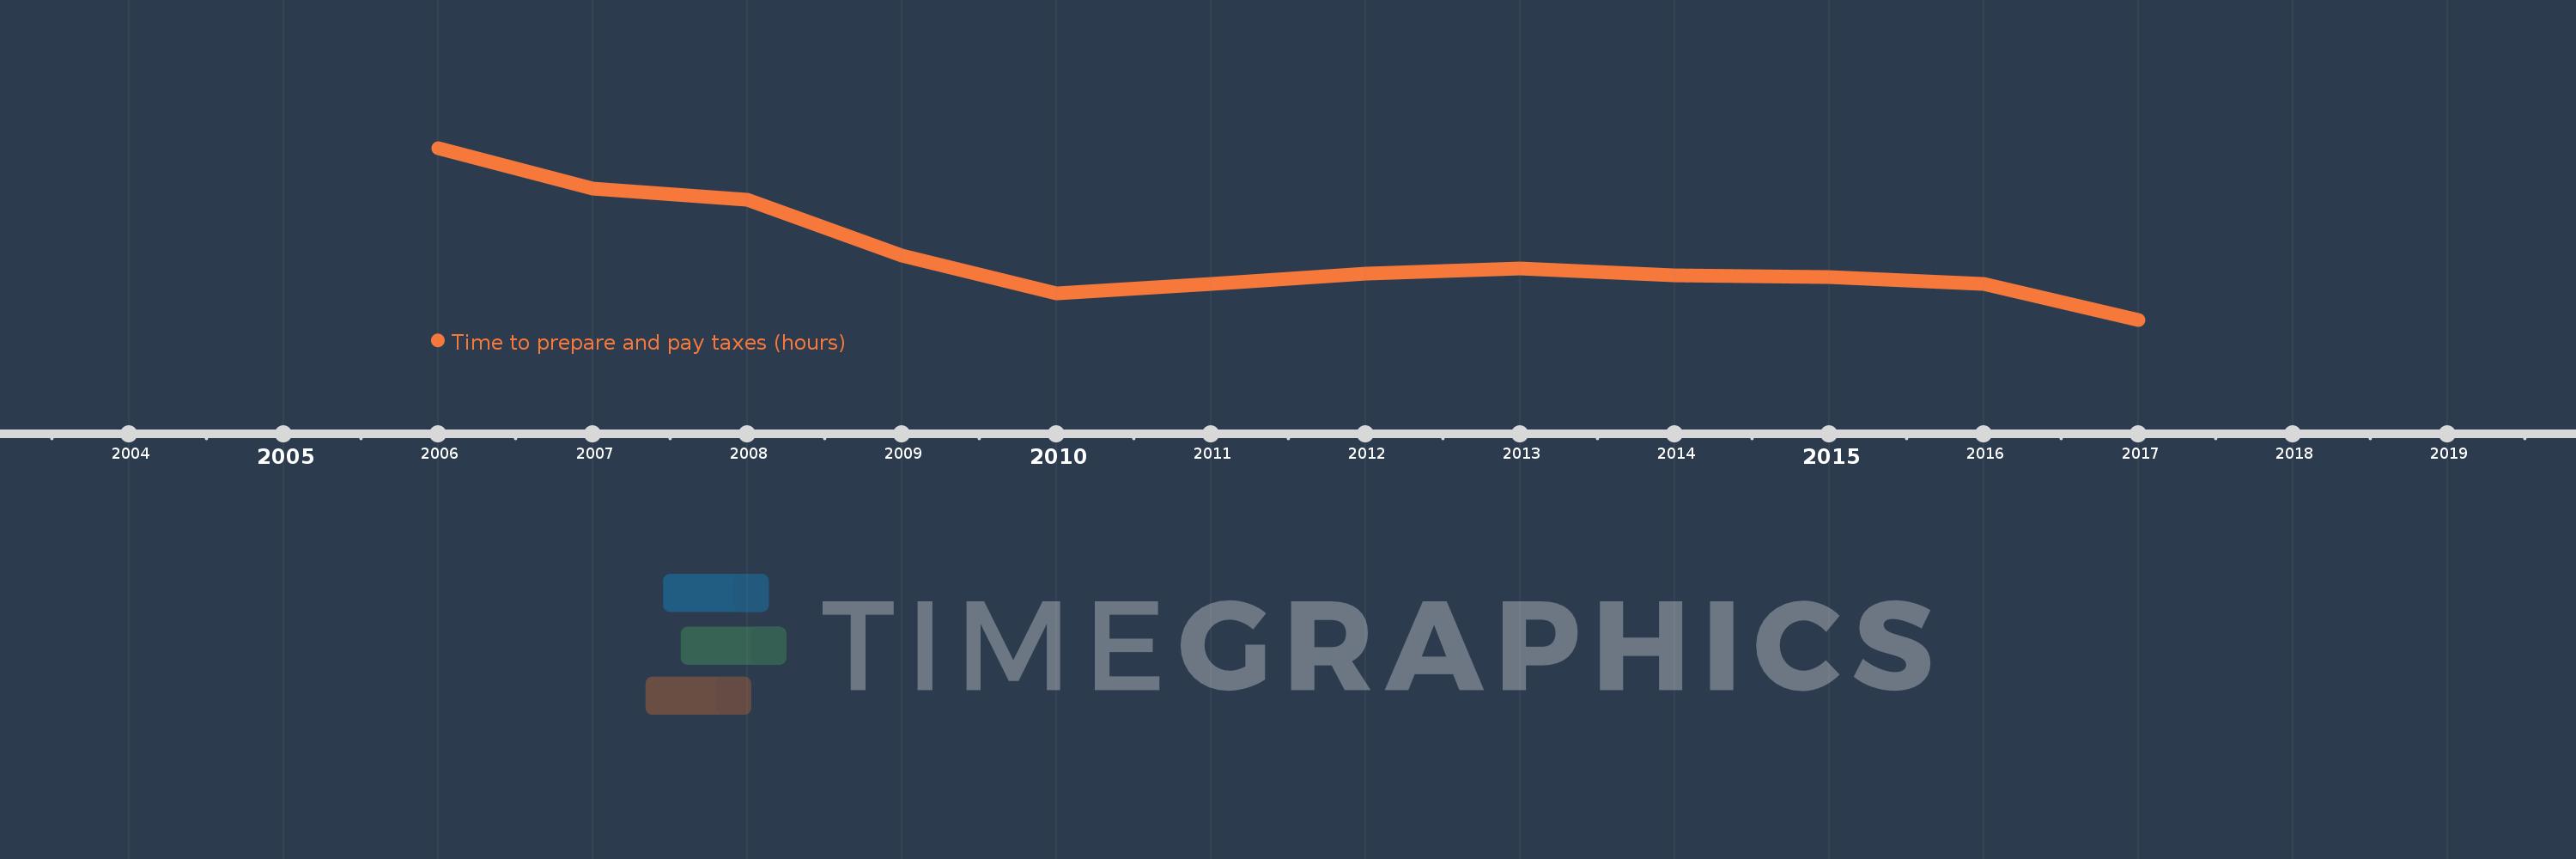
This timeline shows a graph from 2006 to 2017 of Heavily indebted poor countries (HIPC). No data until 2005. Number of actual observations by date: 12.
Source name:
World Development Indicators
Source organization:
World Bank, Doing Business project (http://www.doingbusiness.org/).
Categories, topics:
Private Sector, Public Sector
Last updated:
apr 23, 2017
Indicators value changes by year
Meaning:
331.32
Minimum:
318.987
jan 1, 2017
Maximum:
352.054
jan 1, 2006
At the date of observation
Value
Absolute change
Change from the previous value
jan 1, 2006
352.054
+352.054
0.0%
jan 1, 2007
344.211
-7.844
-2.23%
jan 1, 2008
342.105
-2.105
-0.61%
jan 1, 2009
331.289
-10.816
-3.16%
jan 1, 2010
324.053
-7.237
-2.18%
jan 1, 2011
325.868
+1.816
0.56%
jan 1, 2012
327.908
+2.039
0.63%
jan 1, 2013
328.842
+0.934
0.28%
jan 1, 2014
327.461
-1.382
-0.42%
jan 1, 2015
327.25
-0.211
-0.06%
jan 1, 2016
325.816
-1.434
-0.44%
jan 1, 2017
318.987
-6.829
-2.1%
Ranking of countries by current statistics by years