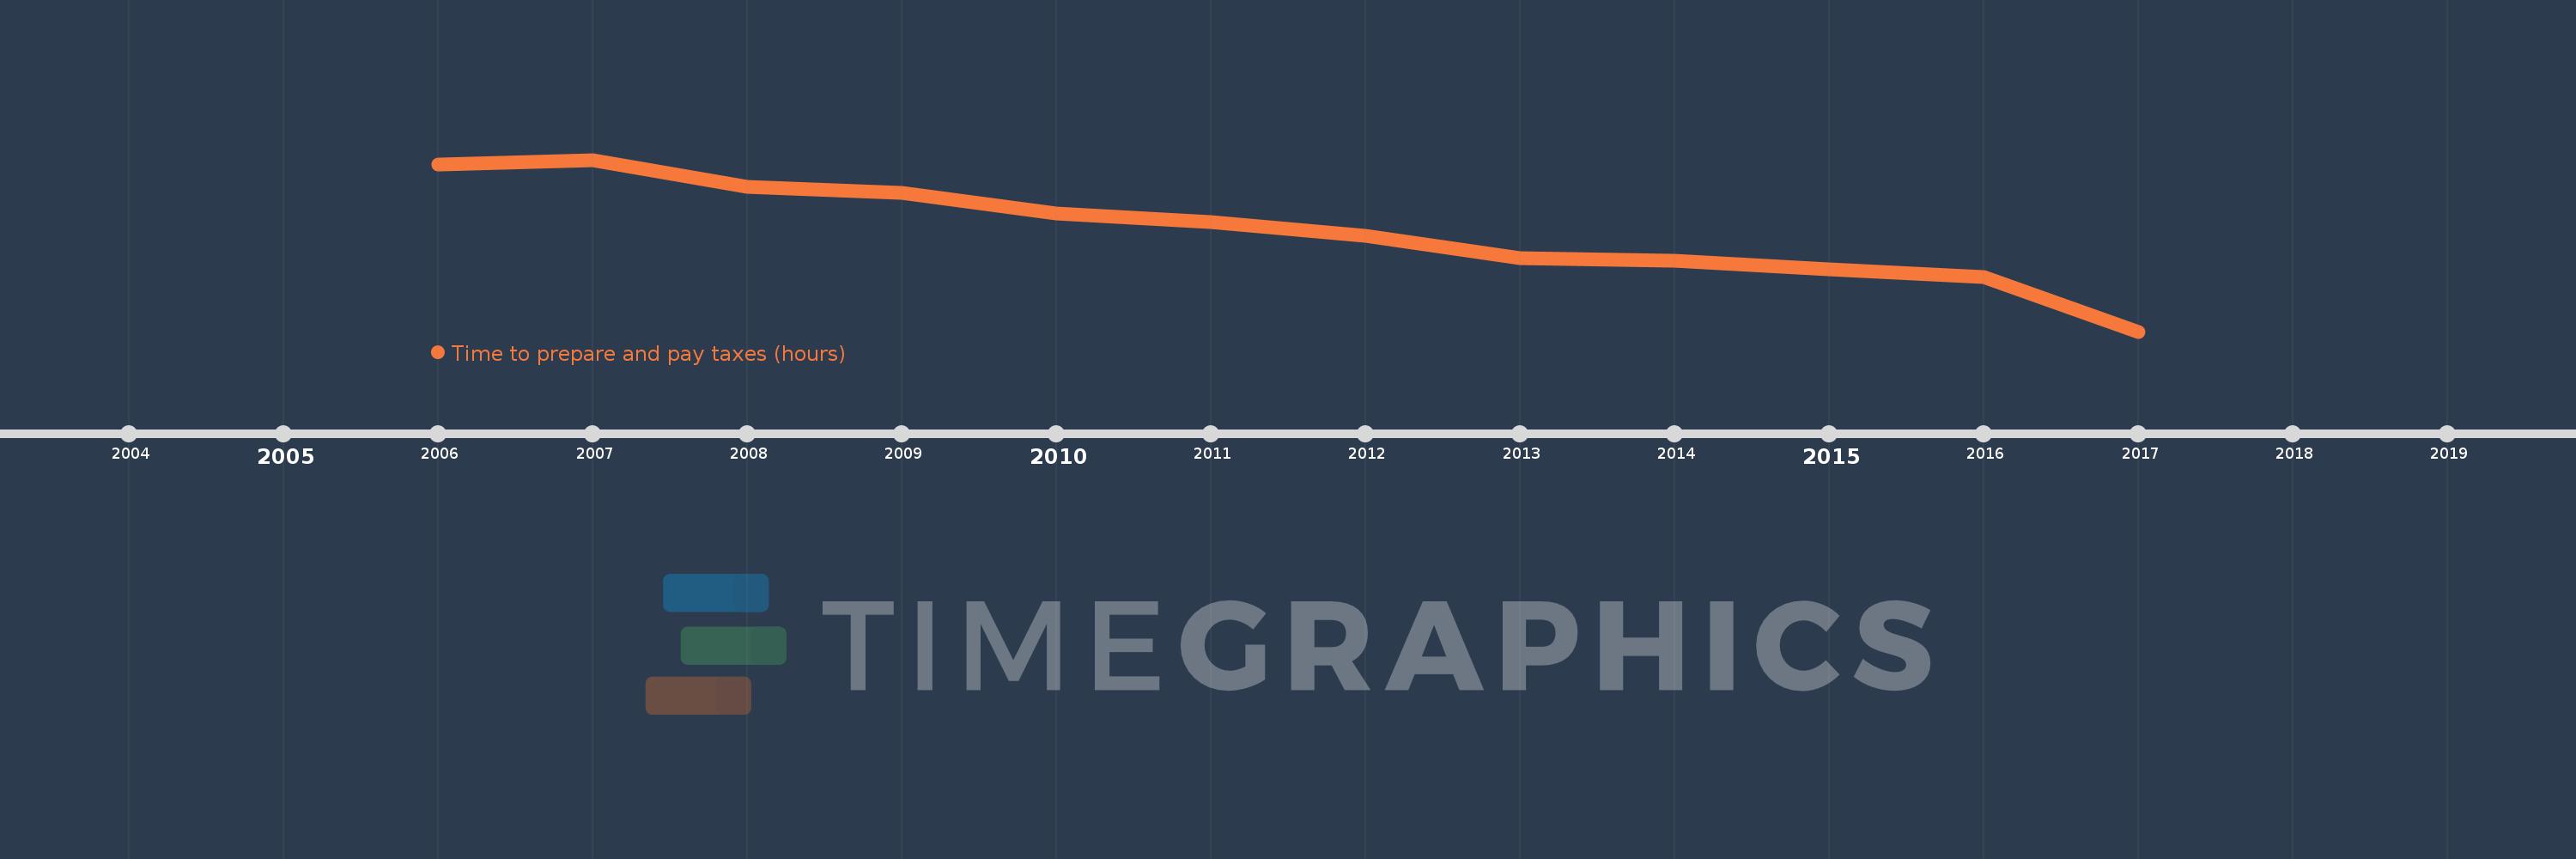
This timeline shows a graph from 2006 to 2017 of Latin America & Caribbean (excluding high income). No data until 2005. Number of actual observations by date: 12.
Source name:
World Development Indicators
Source organization:
World Bank, Doing Business project (http://www.doingbusiness.org/).
Categories, topics:
Private Sector, Public Sector
Last updated:
apr 23, 2017
Indicators value changes by year
Meaning:
425.275
Minimum:
375.36
jan 1, 2017
Maximum:
460.68
jan 1, 2007
At the date of observation
Value
Absolute change
Change from the previous value
jan 1, 2006
458.52
+458.52
0.0%
jan 1, 2007
460.68
+2.16
0.47%
jan 1, 2008
447.04
-13.64
-2.96%
jan 1, 2009
444.108
-2.932
-0.66%
jan 1, 2010
433.892
-10.216
-2.3%
jan 1, 2011
429.76
-4.132
-0.95%
jan 1, 2012
422.92
-6.84
-1.59%
jan 1, 2013
411.64
-11.28
-2.67%
jan 1, 2014
410.38
-1.26
-0.31%
jan 1, 2015
406.48
-3.9
-0.95%
jan 1, 2016
402.52
-3.96
-0.97%
jan 1, 2017
375.36
-27.16
-6.75%
Ranking of countries by current statistics by years