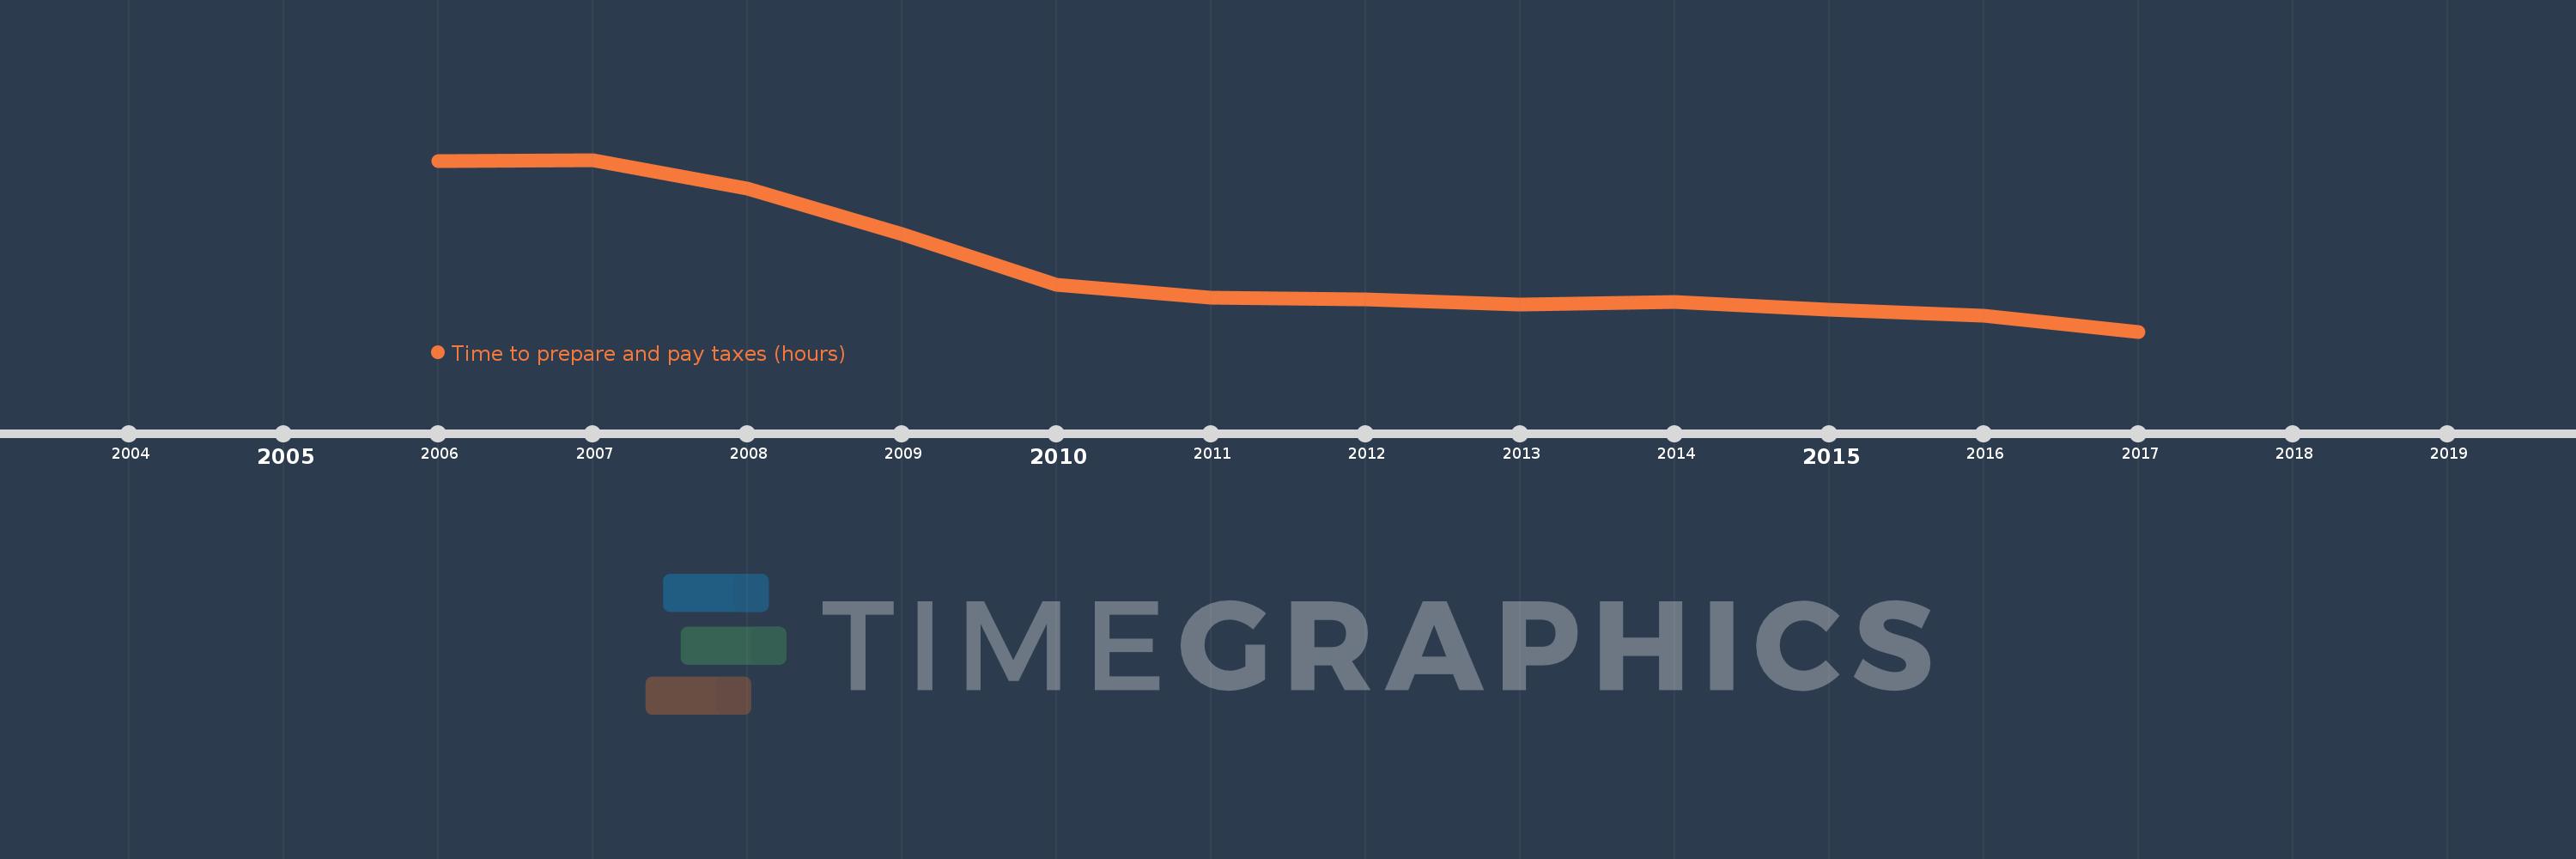
This timeline shows a graph from 2006 to 2017 of East Asia & Pacific (excluding high income). No data until 2005. Number of actual observations by date: 12.
Source name:
World Development Indicators
Source organization:
World Bank, Doing Business project (http://www.doingbusiness.org/).
Categories, topics:
Private Sector, Public Sector
Last updated:
apr 23, 2017
Indicators value changes by year
Meaning:
252.588
Minimum:
214.886
jan 1, 2017
Maximum:
313.175
jan 1, 2007
At the date of observation
Value
Absolute change
Change from the previous value
jan 1, 2006
312.375
+312.375
0.0%
jan 1, 2007
313.175
+0.8
0.26%
jan 1, 2008
296.475
-16.7
-5.33%
jan 1, 2009
270.825
-25.65
-8.65%
jan 1, 2010
241.815
-29.01
-10.71%
jan 1, 2011
234.15
-7.665
-3.17%
jan 1, 2012
233.55
-0.6
-0.26%
jan 1, 2013
230.5
-3.05
-1.31%
jan 1, 2014
231.929
+1.429
0.62%
jan 1, 2015
227.333
-4.595
-1.98%
jan 1, 2016
224.048
-3.286
-1.45%
jan 1, 2017
214.886
-9.162
-4.09%
Ranking of countries by current statistics by years