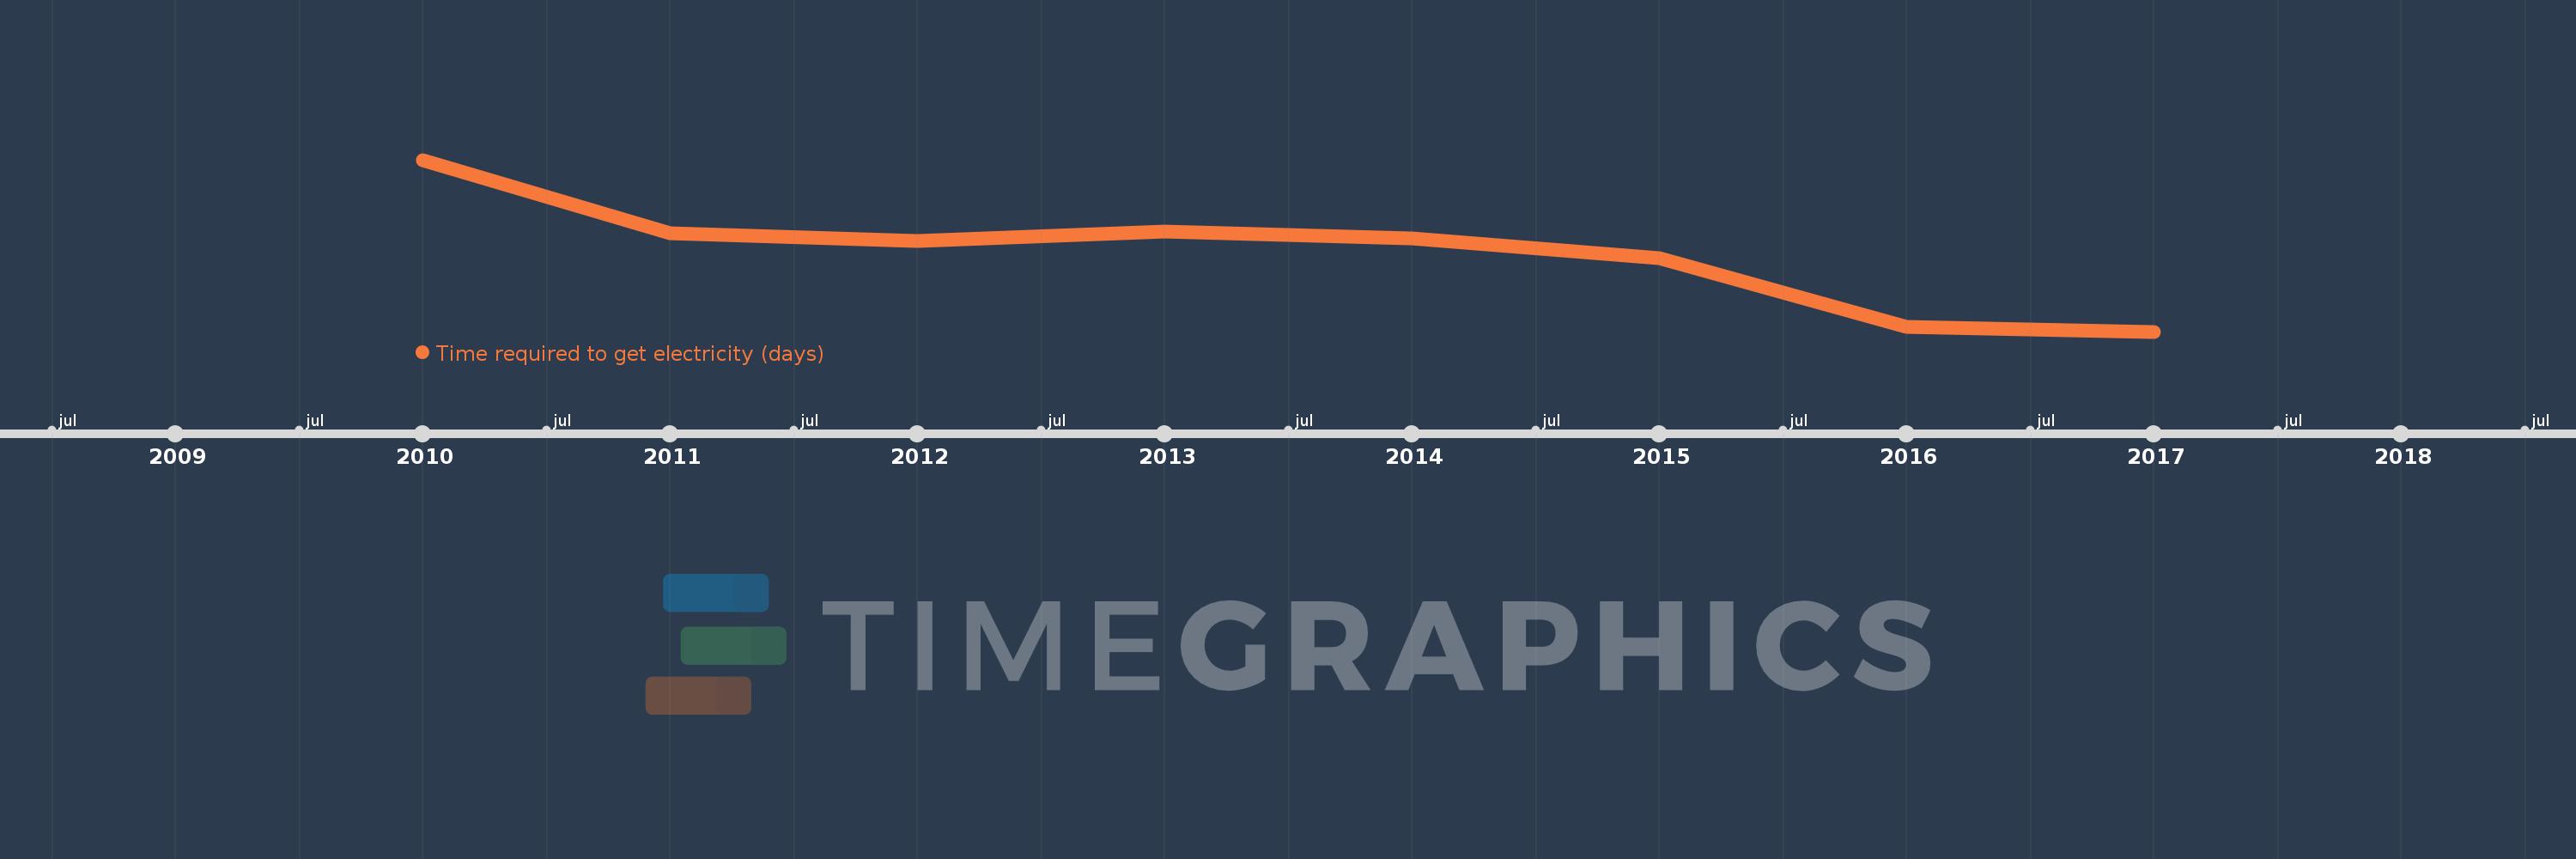
This timeline shows a graph from 2010 to 2017 of Sub-Saharan Africa (IDA & IBRD countries). No data until 2009. Number of actual observations by date: 8.
Source name:
World Development Indicators
Source organization:
World Bank, Doing Business project (http://www.doingbusiness.org/).
Categories, topics:
Energy & Mining, Private Sector
Last updated:
apr 23, 2017
Indicators value changes by year
Meaning:
138.018
Minimum:
120.439
jan 1, 2017
Maximum:
158.674
jan 1, 2010
At the date of observation
Value
Absolute change
Change from the previous value
jan 1, 2010
158.674
+158.674
0.0%
jan 1, 2011
142.283
-16.391
-10.33%
jan 1, 2012
140.543
-1.739
-1.22%
jan 1, 2013
142.638
+2.095
1.49%
jan 1, 2014
141.247
-1.391
-0.98%
jan 1, 2015
136.834
-4.413
-3.12%
jan 1, 2016
121.483
-15.351
-11.22%
jan 1, 2017
120.439
-1.043
-0.86%
Ranking of countries by current statistics by years