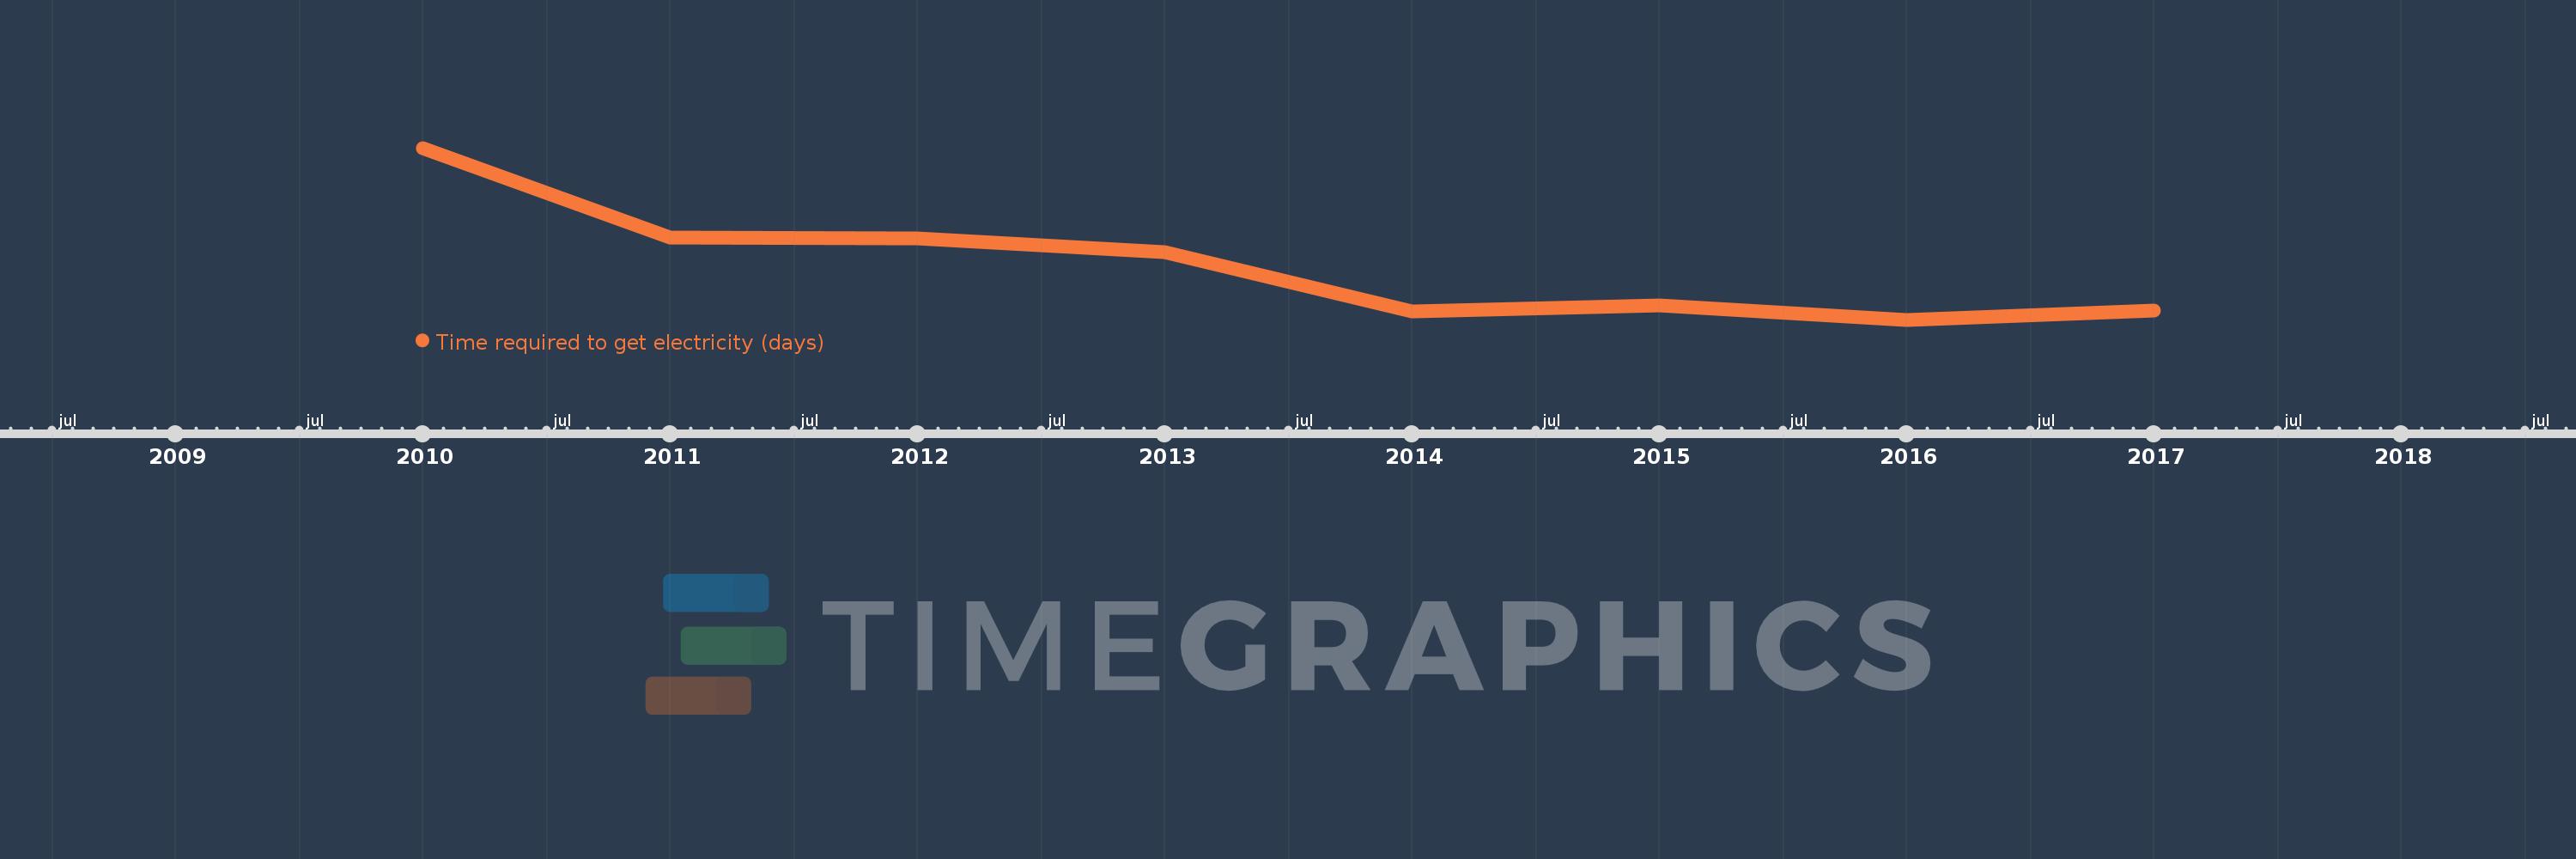
This timeline shows a graph from 2010 to 2017 of Latin America & Caribbean (excluding high income). No data until 2009. Number of actual observations by date: 8.
Source name:
World Development Indicators
Source organization:
World Bank, Doing Business project (http://www.doingbusiness.org/).
Categories, topics:
Energy & Mining, Private Sector
Last updated:
apr 23, 2017
Indicators value changes by year
Meaning:
73.63
Minimum:
69.568
jan 1, 2016
Maximum:
82.4
jan 1, 2010
At the date of observation
Value
Absolute change
Change from the previous value
jan 1, 2010
82.4
+82.4
0.0%
jan 1, 2011
75.68
-6.72
-8.16%
jan 1, 2012
75.64
-0.04
-0.05%
jan 1, 2013
74.64
-1.0
-1.32%
jan 1, 2014
70.22
-4.42
-5.92%
jan 1, 2015
70.66
+0.44
0.63%
jan 1, 2016
69.568
-1.092
-1.55%
jan 1, 2017
70.232
+0.664
0.95%
Ranking of countries by current statistics by years