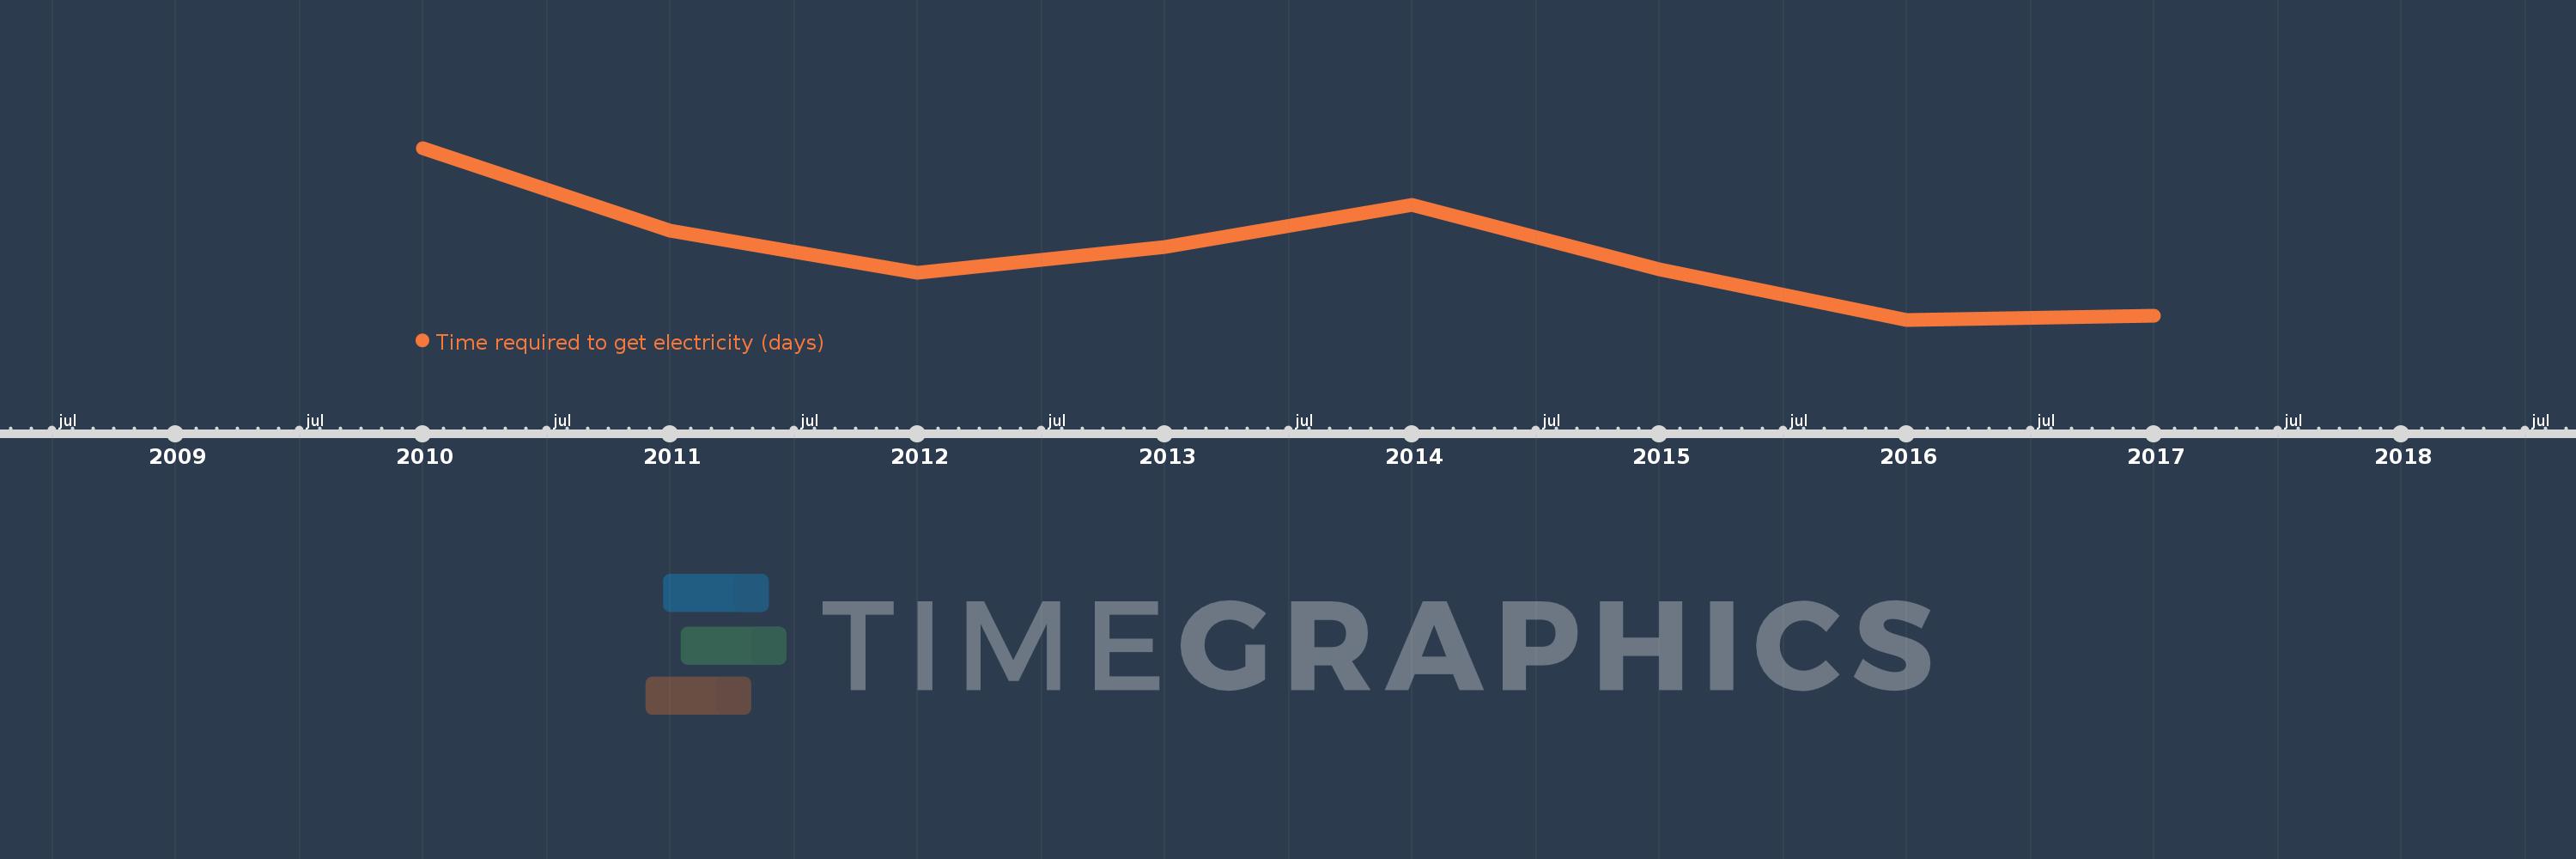
This timeline shows a graph from 2010 to 2017 of Fragile and conflict affected situations. No data until 2009. Number of actual observations by date: 8.
Source name:
World Development Indicators
Source organization:
World Bank, Doing Business project (http://www.doingbusiness.org/).
Categories, topics:
Energy & Mining, Private Sector
Last updated:
apr 23, 2017
Indicators value changes by year
Meaning:
136.695
Minimum:
119.903
jan 1, 2016
Maximum:
161.833
jan 1, 2010
At the date of observation
Value
Absolute change
Change from the previous value
jan 1, 2010
161.833
+161.833
0.0%
jan 1, 2011
141.7
-20.133
-12.44%
jan 1, 2012
131.467
-10.233
-7.22%
jan 1, 2013
137.758
+6.291
4.79%
jan 1, 2014
147.909
+10.152
7.37%
jan 1, 2015
132.182
-15.727
-10.63%
jan 1, 2016
119.903
-12.279
-9.29%
jan 1, 2017
120.806
+0.903
0.75%
Ranking of countries by current statistics by years