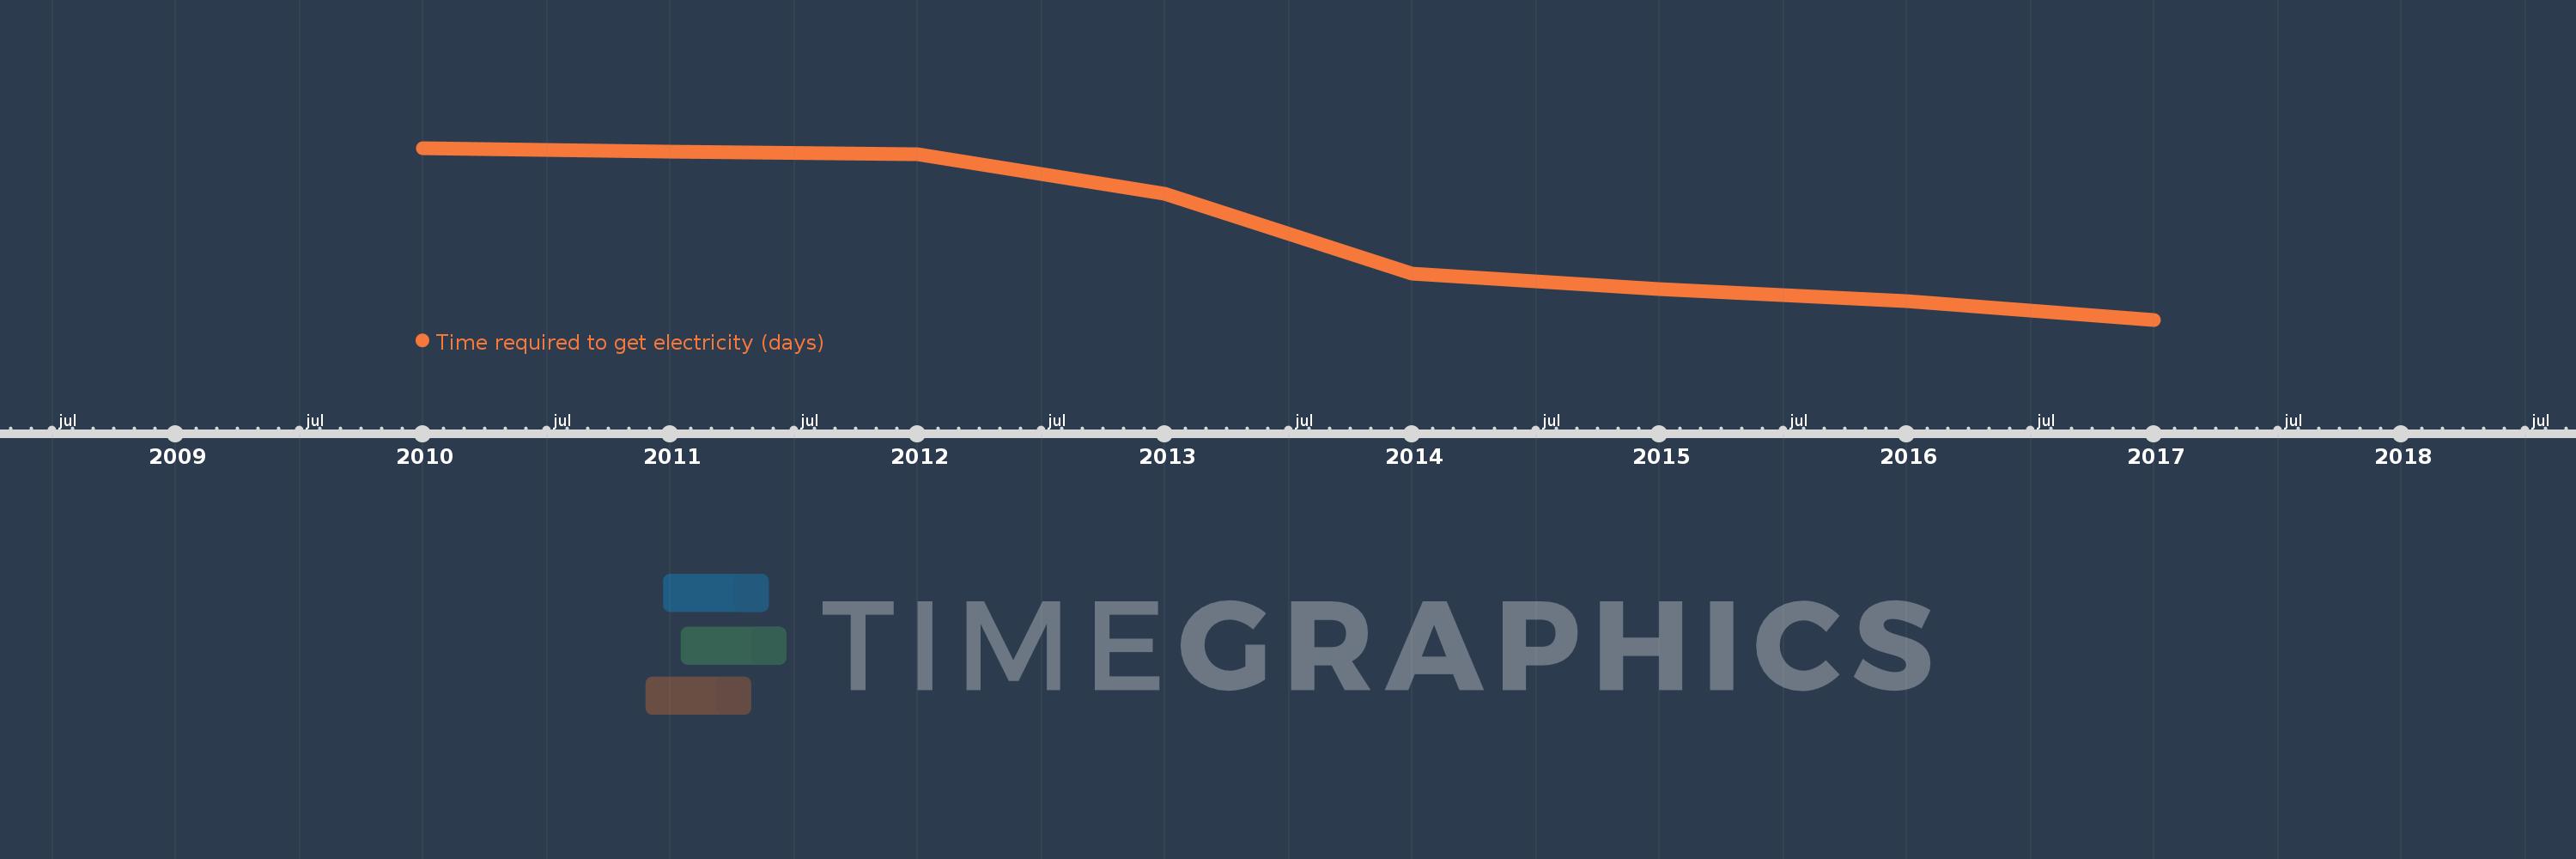
This timeline shows a graph from 2010 to 2017 of Europe & Central Asia (excluding high income). No data until 2009. Number of actual observations by date: 8.
Source name:
World Development Indicators
Source organization:
World Bank, Doing Business project (http://www.doingbusiness.org/).
Categories, topics:
Energy & Mining, Private Sector
Last updated:
apr 23, 2017
Indicators value changes by year
Meaning:
139.559
Minimum:
118.475
jan 1, 2017
Maximum:
158.3
jan 1, 2010
At the date of observation
Value
Absolute change
Change from the previous value
jan 1, 2010
158.3
+158.3
0.0%
jan 1, 2011
157.5
-0.8
-0.51%
jan 1, 2012
156.9
-0.6
-0.38%
jan 1, 2013
147.75
-9.15
-5.83%
jan 1, 2014
129.26
-18.49
-12.51%
jan 1, 2015
125.51
-3.75
-2.9%
jan 1, 2016
122.775
-2.735
-2.18%
jan 1, 2017
118.475
-4.3
-3.5%
Ranking of countries by current statistics by years