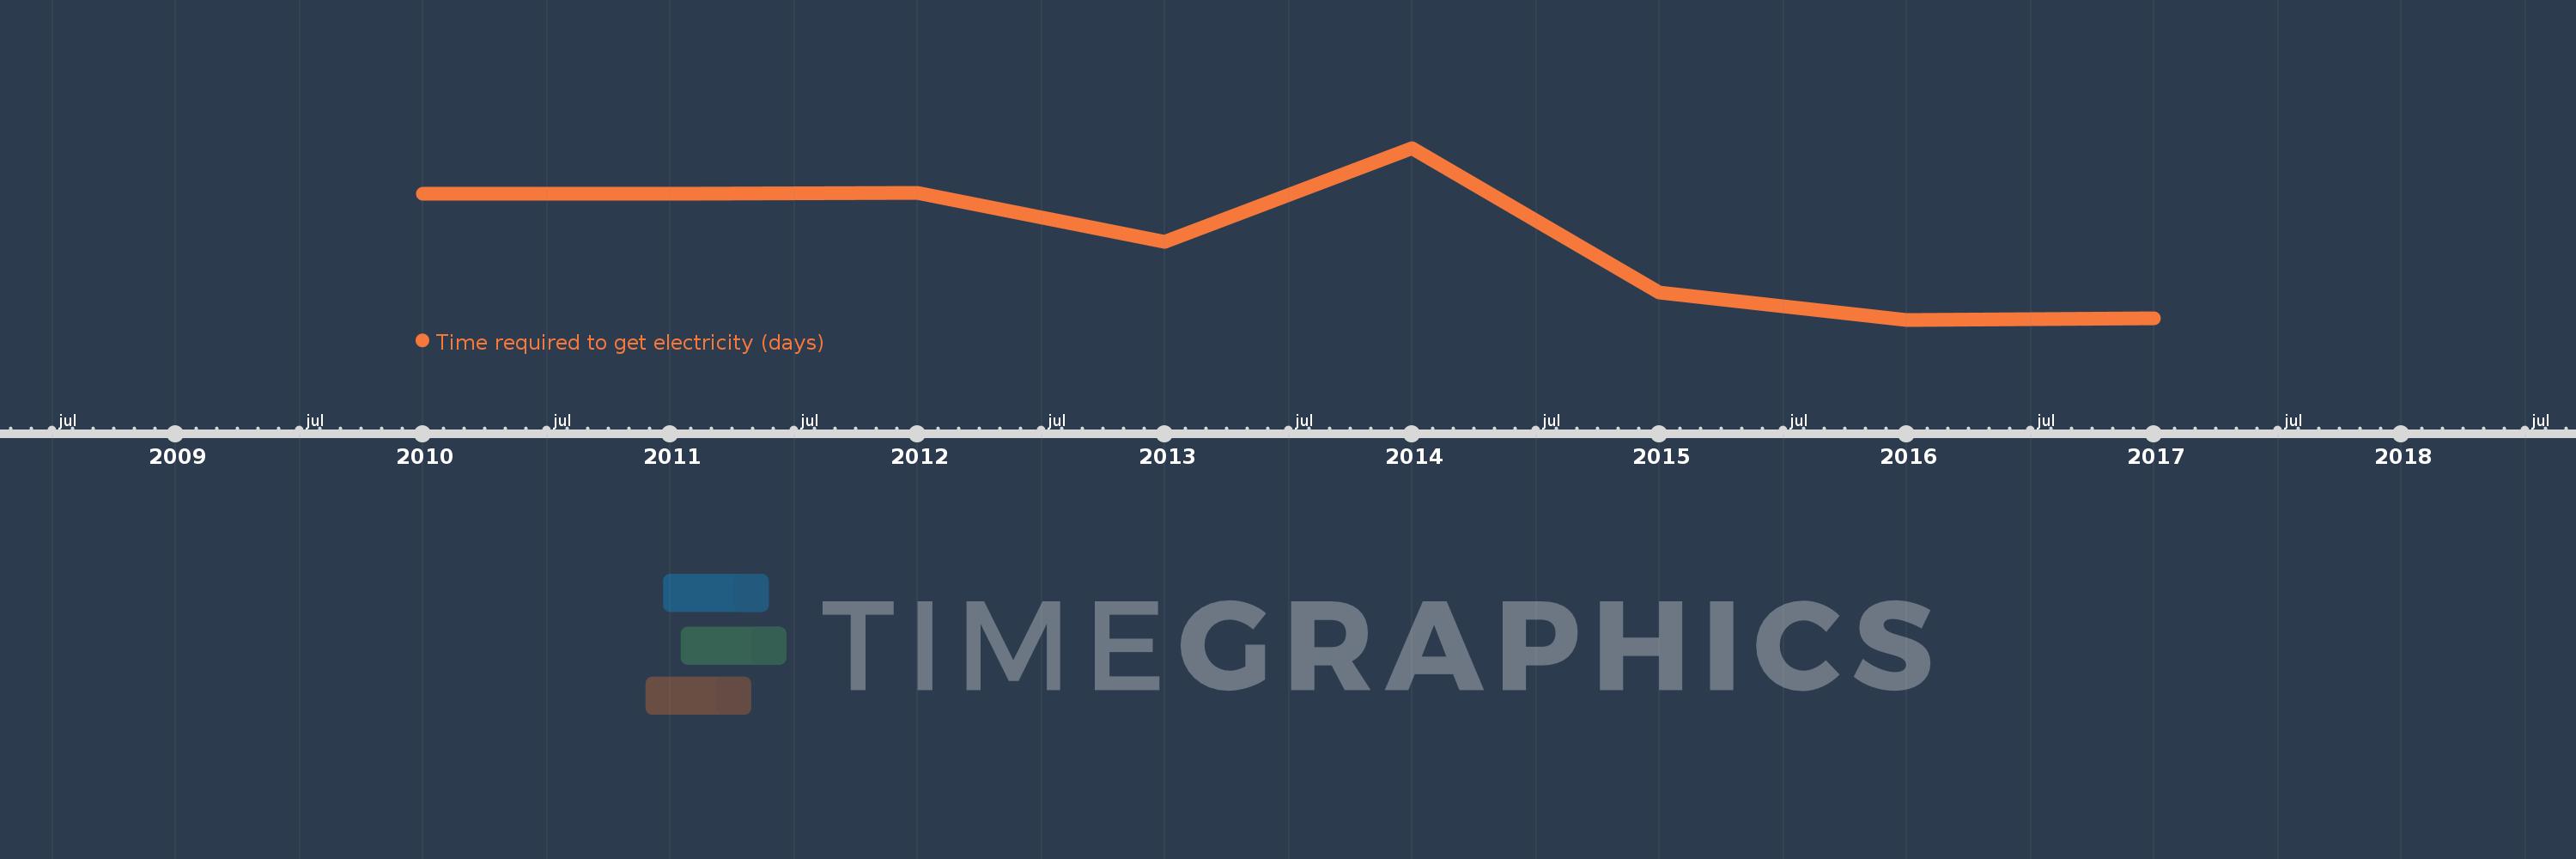
This timeline shows a graph from 2010 to 2017 of East Asia & Pacific (excluding high income). No data until 2009. Number of actual observations by date: 8.
Source name:
World Development Indicators
Source organization:
World Bank, Doing Business project (http://www.doingbusiness.org/).
Categories, topics:
Energy & Mining, Private Sector
Last updated:
apr 23, 2017
Indicators value changes by year
Meaning:
94.021
Minimum:
81.105
jan 1, 2016
Maximum:
108.095
jan 1, 2014
At the date of observation
Value
Absolute change
Change from the previous value
jan 1, 2010
100.9
+100.9
0.0%
jan 1, 2011
100.9
0.0
0.0%
jan 1, 2012
101.1
+0.2
0.2%
jan 1, 2013
93.333
-7.767
-7.68%
jan 1, 2014
108.095
+14.762
15.82%
jan 1, 2015
85.357
-22.738
-21.04%
jan 1, 2016
81.105
-4.252
-4.98%
jan 1, 2017
81.376
+0.271
0.33%
Ranking of countries by current statistics by years