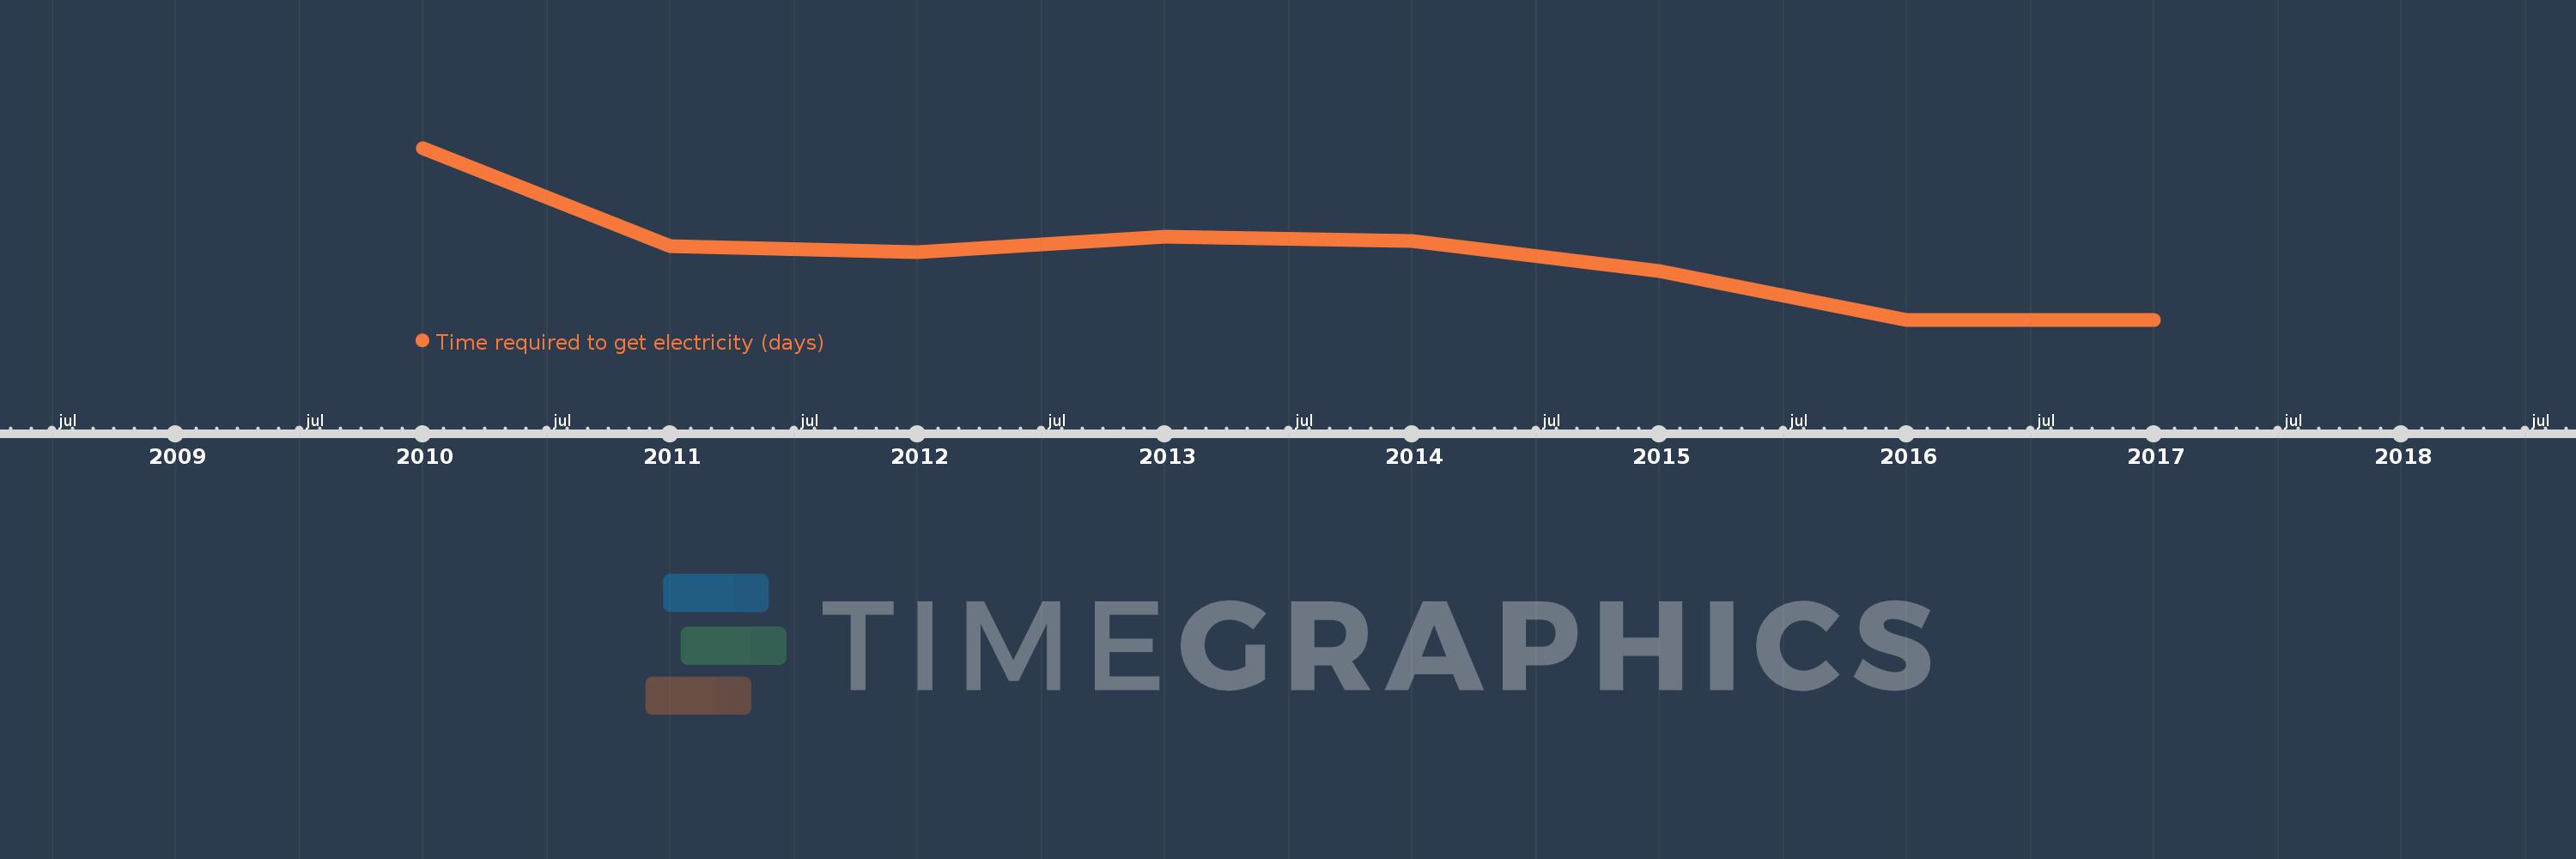
This timeline shows a graph from 2010 to 2017 of Least developed countries: UN classification. No data until 2009. Number of actual observations by date: 8.
Source name:
World Development Indicators
Source organization:
World Bank, Doing Business project (http://www.doingbusiness.org/).
Categories, topics:
Energy & Mining, Private Sector
Last updated:
apr 23, 2017
Indicators value changes by year
Meaning:
142.805
Minimum:
127.998
jan 1, 2017
Maximum:
166.818
jan 1, 2010
At the date of observation
Value
Absolute change
Change from the previous value
jan 1, 2010
166.818
+166.818
0.0%
jan 1, 2011
144.614
-22.205
-13.31%
jan 1, 2012
143.341
-1.273
-0.88%
jan 1, 2013
146.761
+3.42
2.39%
jan 1, 2014
145.846
-0.915
-0.62%
jan 1, 2015
139.041
-6.804
-4.67%
jan 1, 2016
128.02
-11.021
-7.93%
jan 1, 2017
127.998
-0.023
-0.02%
Ranking of countries by current statistics by years