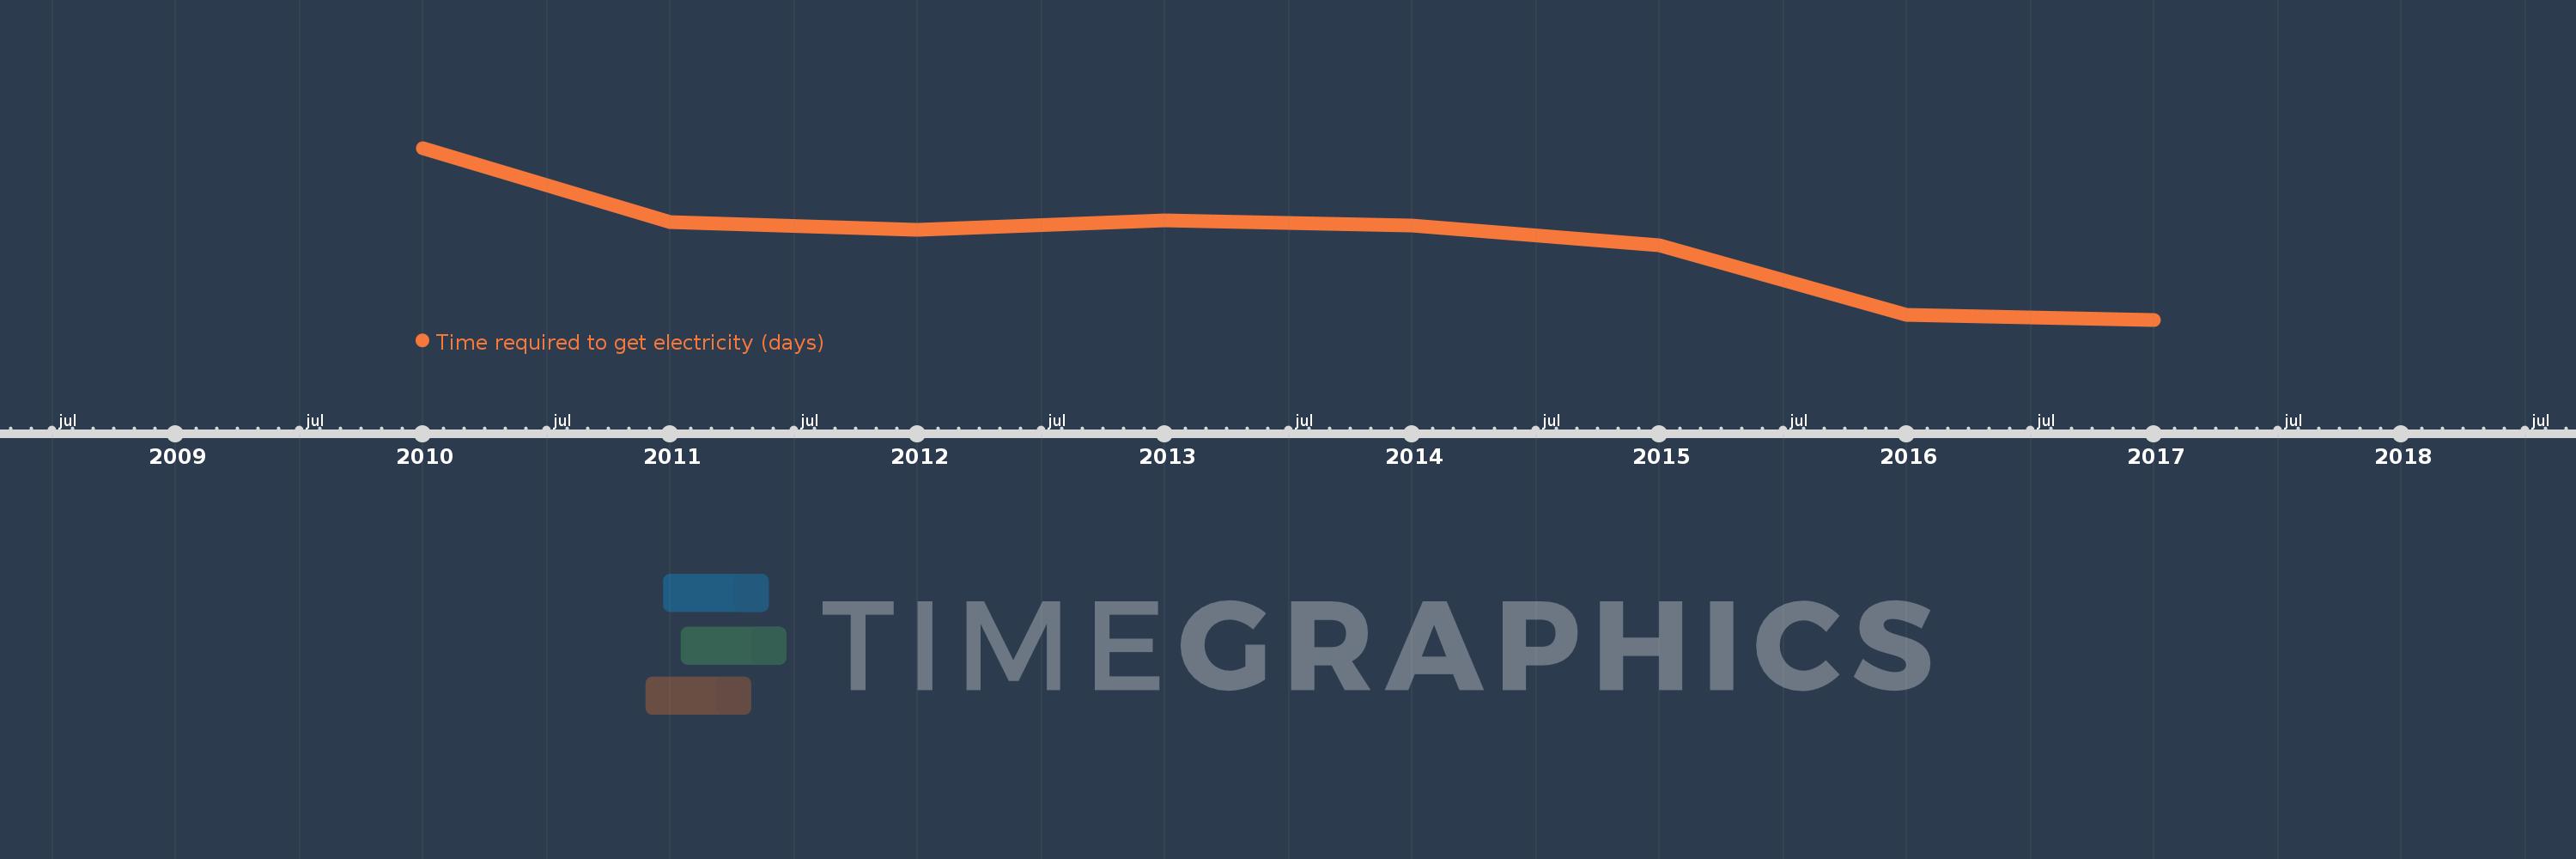
This timeline shows a graph from 2010 to 2017 of Sub-Saharan Africa (excluding high income). No data until 2009. Number of actual observations by date: 8.
Source name:
World Development Indicators
Source organization:
World Bank, Doing Business project (http://www.doingbusiness.org/).
Categories, topics:
Energy & Mining, Private Sector
Last updated:
apr 23, 2017
Indicators value changes by year
Meaning:
137.929
Minimum:
120.071
jan 1, 2017
Maximum:
158.933
jan 1, 2010
At the date of observation
Value
Absolute change
Change from the previous value
jan 1, 2010
158.933
+158.933
0.0%
jan 1, 2011
142.178
-16.756
-10.54%
jan 1, 2012
140.4
-1.778
-1.25%
jan 1, 2013
142.543
+2.143
1.53%
jan 1, 2014
141.339
-1.204
-0.84%
jan 1, 2015
136.83
-4.509
-3.19%
jan 1, 2016
121.138
-15.693
-11.47%
jan 1, 2017
120.071
-1.067
-0.88%
Ranking of countries by current statistics by years