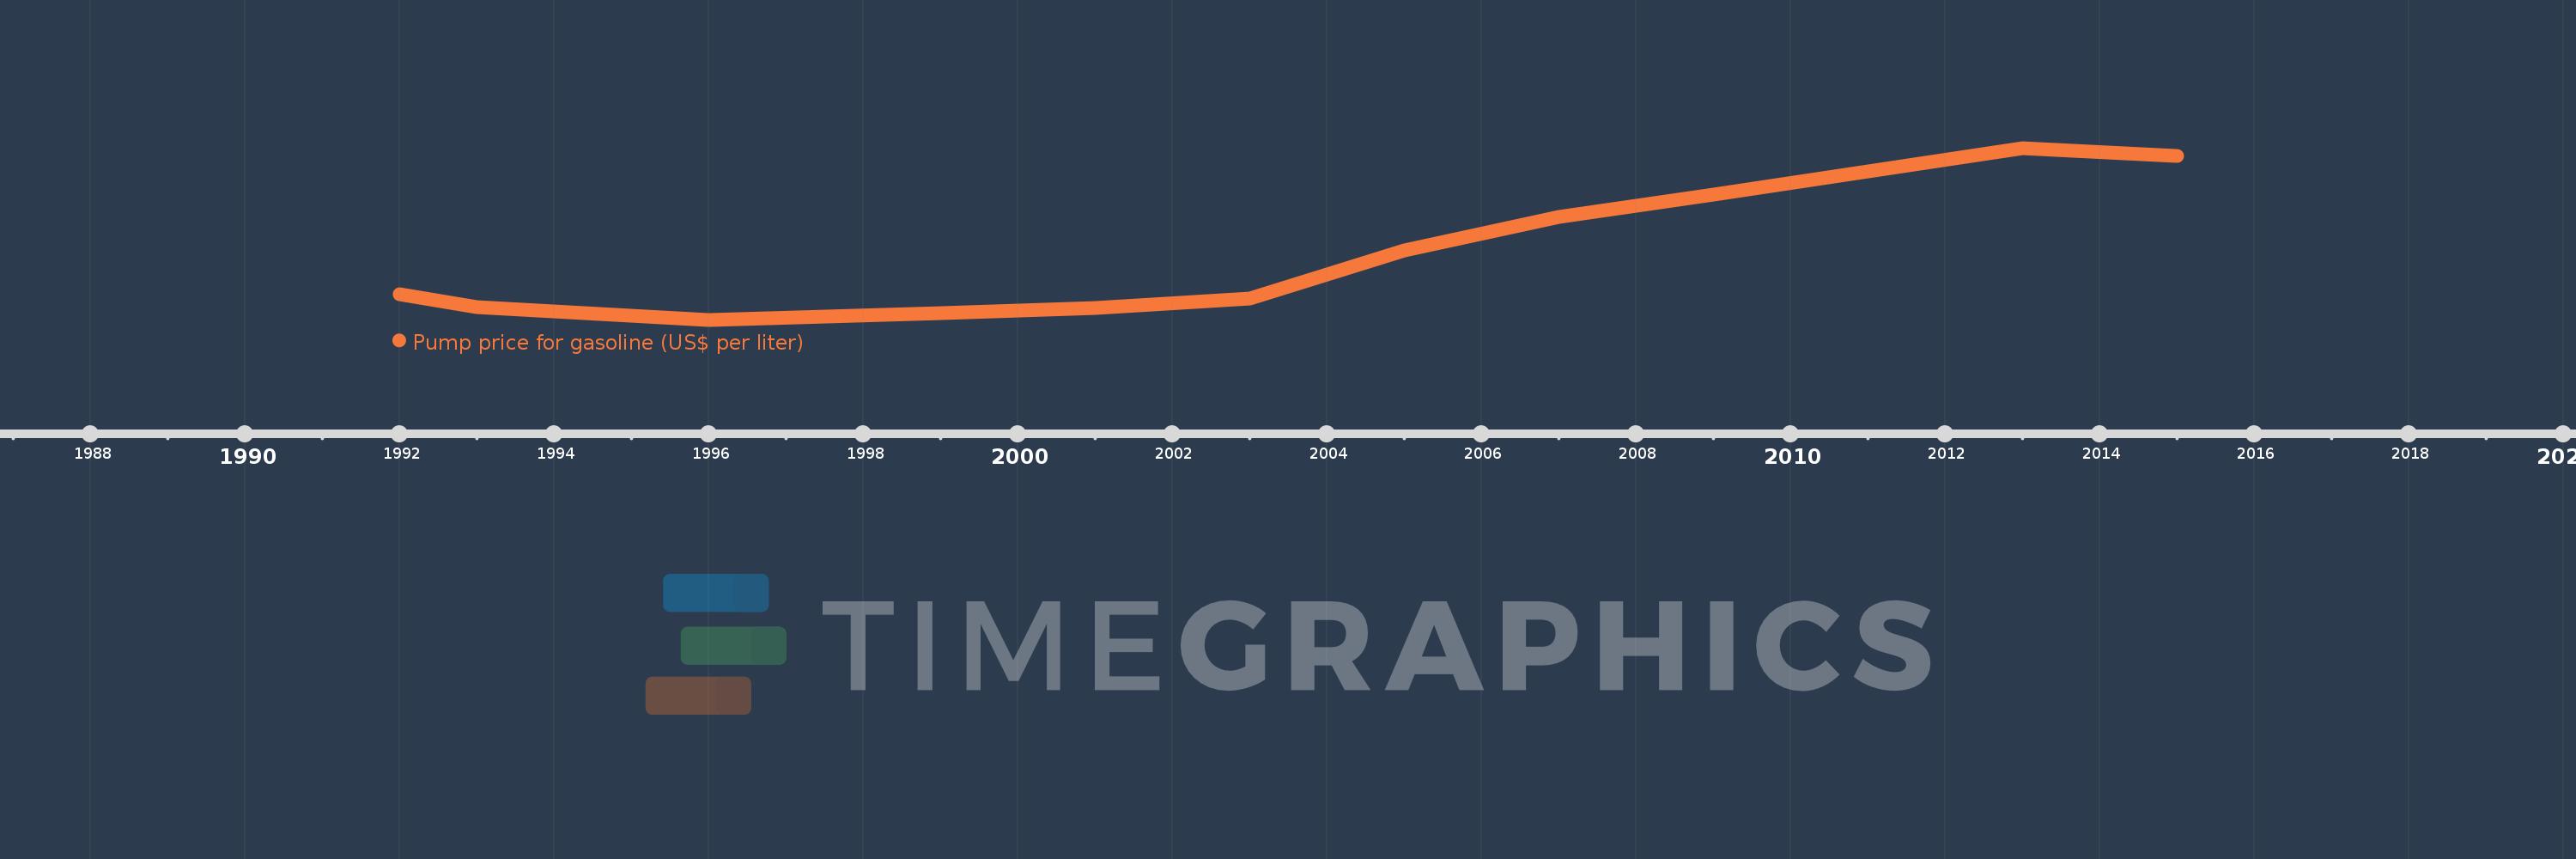
This timeline shows a graph from 1992 to 2015 of Sub-Saharan Africa (IDA & IBRD countries). No data until 1991. Number of actual observations by date: 12.
Source name:
World Development Indicators
Source organization:
German Agency for International Cooperation (GIZ).
Categories, topics:
Energy & Mining, Urban Development
Last updated:
apr 23, 2017
Indicators value changes by year
Meaning:
0.892
Minimum:
0.56
jan 1, 1996
Maximum:
1.355
jan 1, 2013
At the date of observation
Value
Absolute change
Change from the previous value
jan 1, 1992
0.68
+0.68
0.0%
jan 1, 1993
0.62
-0.06
-8.82%
jan 1, 1996
0.56
-0.06
-9.68%
jan 1, 1999
0.59
+0.03
5.36%
jan 1, 2001
0.615
+0.025
4.24%
jan 1, 2003
0.66
+0.045
7.32%
jan 1, 2005
0.88
+0.22
33.33%
jan 1, 2007
1.035
+0.155
17.61%
jan 1, 2009
1.14
+0.105
10.14%
jan 1, 2011
1.245
+0.105
9.21%
jan 1, 2013
1.355
+0.11
8.84%
jan 1, 2015
1.32
-0.035
-2.58%
Ranking of countries by current statistics by years