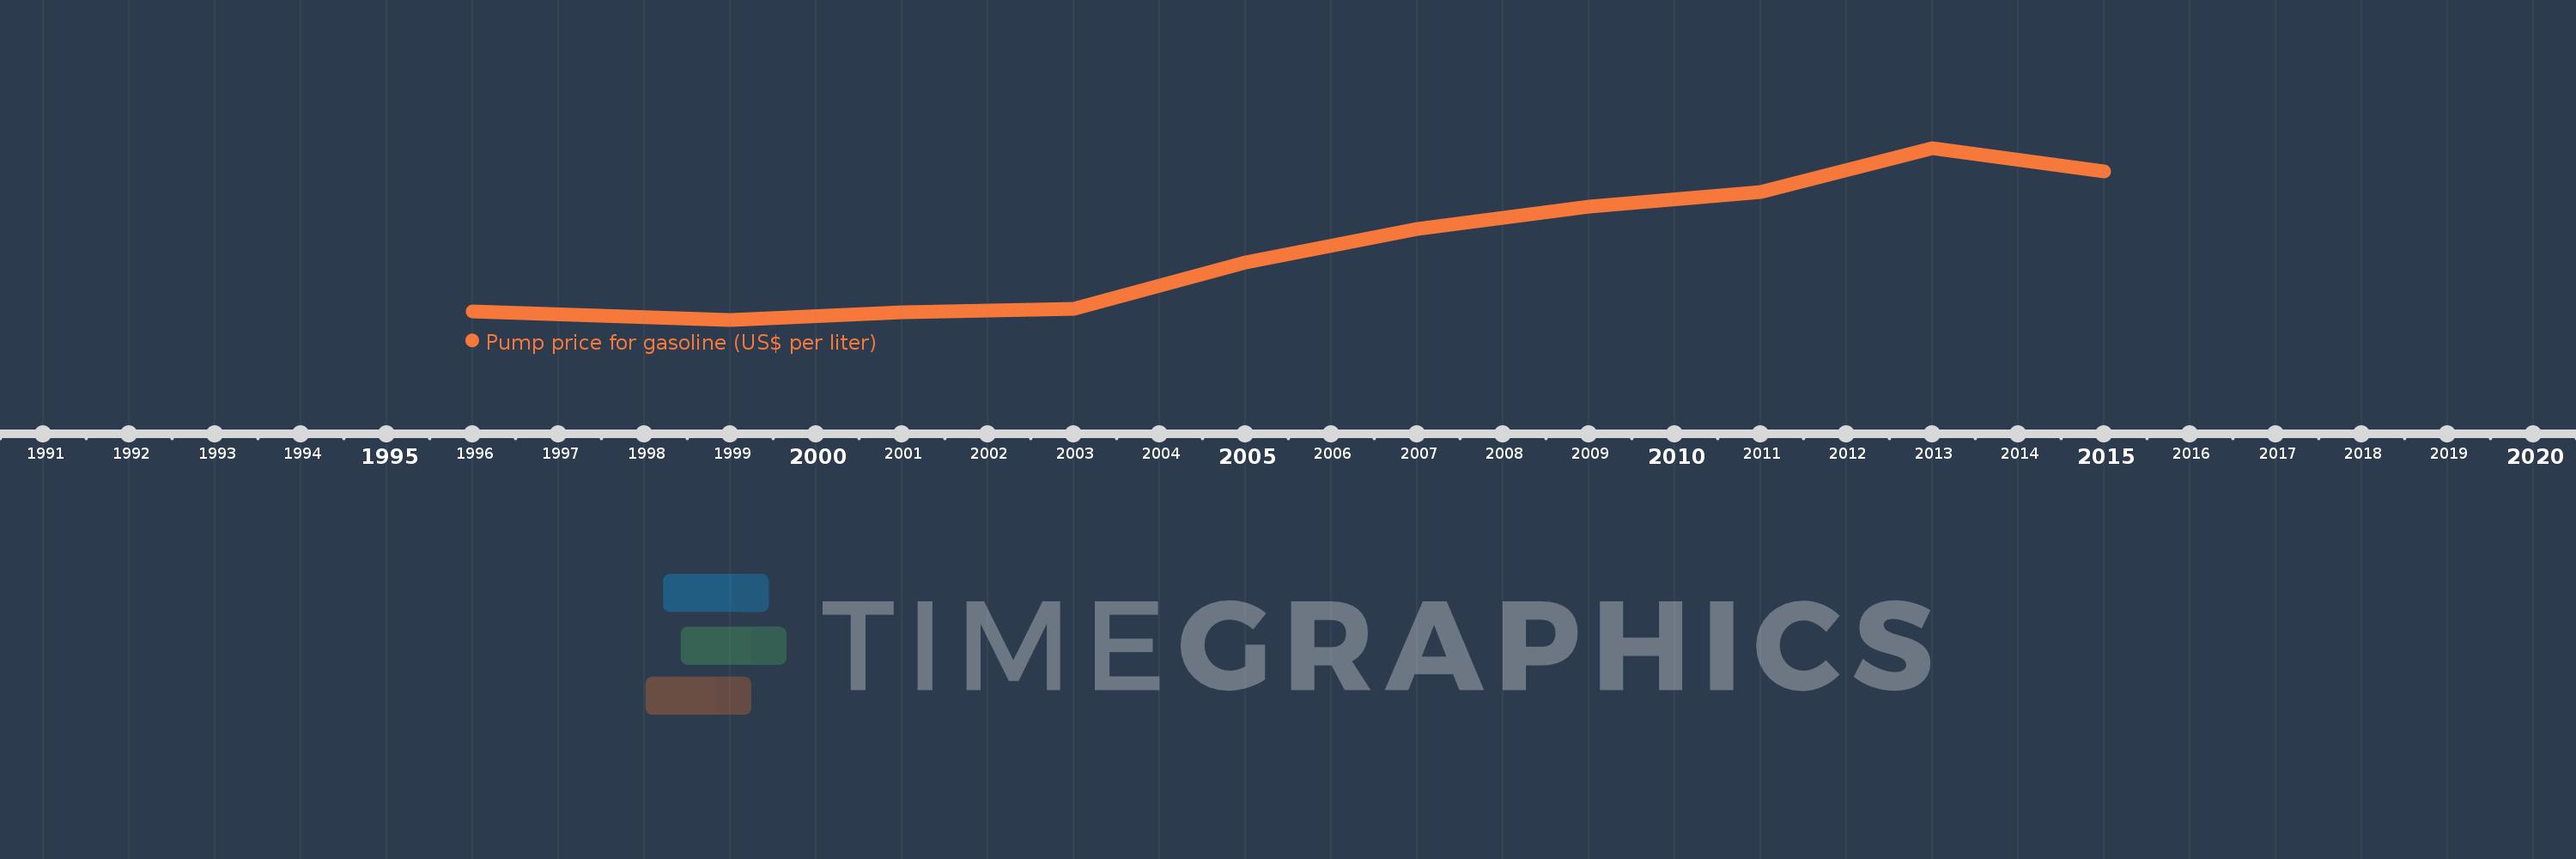
This timeline shows a graph from 1996 to 2015 of Europe & Central Asia (IDA & IBRD countries). No data until 1995. Number of actual observations by date: 10.
Source name:
World Development Indicators
Source organization:
German Agency for International Cooperation (GIZ).
Categories, topics:
Energy & Mining, Urban Development
Last updated:
apr 23, 2017
Indicators value changes by year
Meaning:
0.912
Minimum:
0.51
jan 1, 1999
Maximum:
1.45
jan 1, 2013
At the date of observation
Value
Absolute change
Change from the previous value
jan 1, 1996
0.555
+0.555
0.0%
jan 1, 1999
0.51
-0.045
-8.11%
jan 1, 2001
0.55
+0.04
7.84%
jan 1, 2003
0.57
+0.02
3.64%
jan 1, 2005
0.825
+0.255
44.74%
jan 1, 2007
1.005
+0.18
21.82%
jan 1, 2009
1.13
+0.125
12.44%
jan 1, 2011
1.21
+0.08
7.08%
jan 1, 2013
1.45
+0.24
19.83%
jan 1, 2015
1.32
-0.13
-8.97%
Ranking of countries by current statistics by years