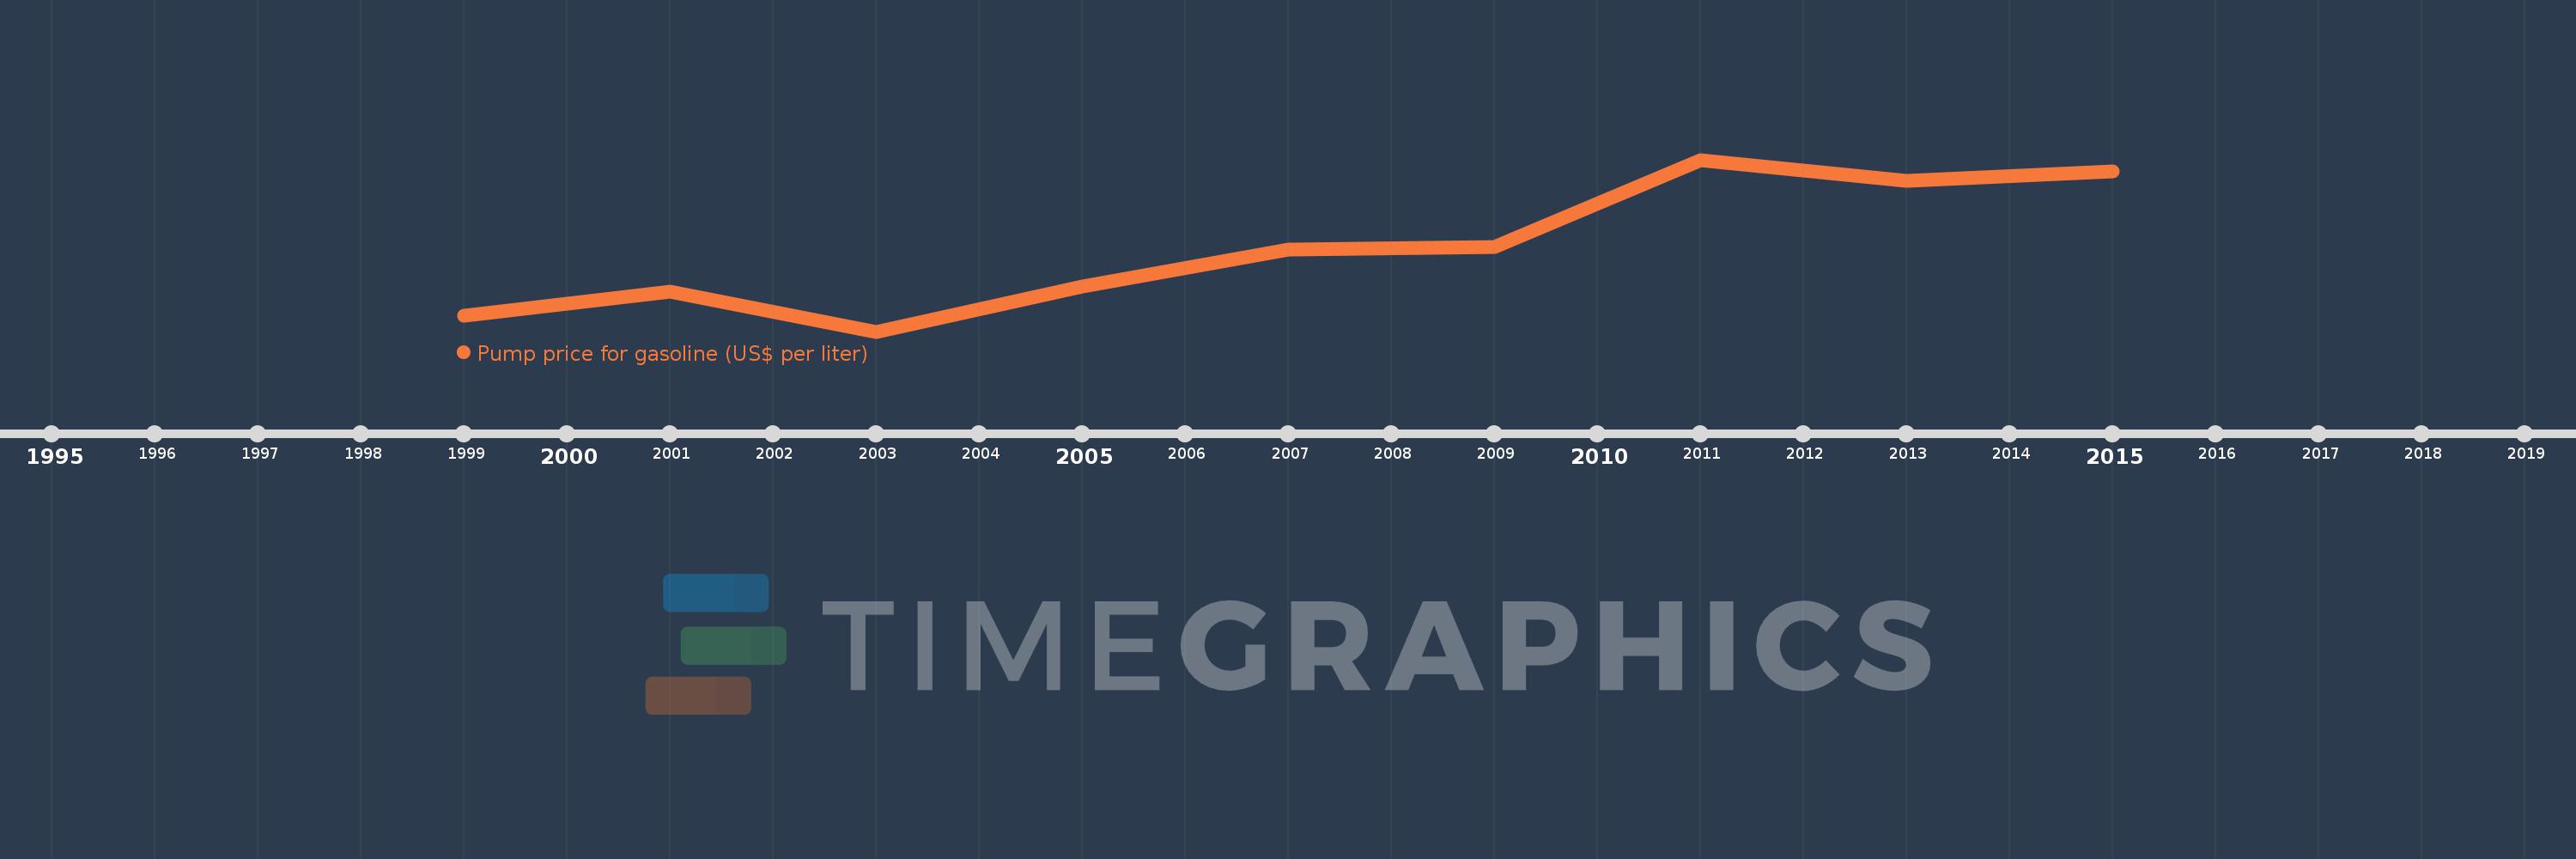
This timeline shows a graph from 1999 to 2015 of Middle East & North Africa (excluding high income). No data until 1998. Number of actual observations by date: 9.
Source name:
World Development Indicators
Source organization:
German Agency for International Cooperation (GIZ).
Categories, topics:
Energy & Mining, Urban Development
Last updated:
apr 23, 2017
Indicators value changes by year
Meaning:
0.605
Minimum:
0.29
jan 1, 2003
Maximum:
0.94
jan 1, 2011
At the date of observation
Value
Absolute change
Change from the previous value
jan 1, 1999
0.35
+0.35
0.0%
jan 1, 2001
0.44
+0.09
25.71%
jan 1, 2003
0.29
-0.15
-34.09%
jan 1, 2005
0.46
+0.17
58.62%
jan 1, 2007
0.6
+0.14
30.43%
jan 1, 2009
0.61
+0.01
1.67%
jan 1, 2011
0.94
+0.33
54.1%
jan 1, 2013
0.86
-0.08
-8.51%
jan 1, 2015
0.895
+0.035
4.07%
Ranking of countries by current statistics by years