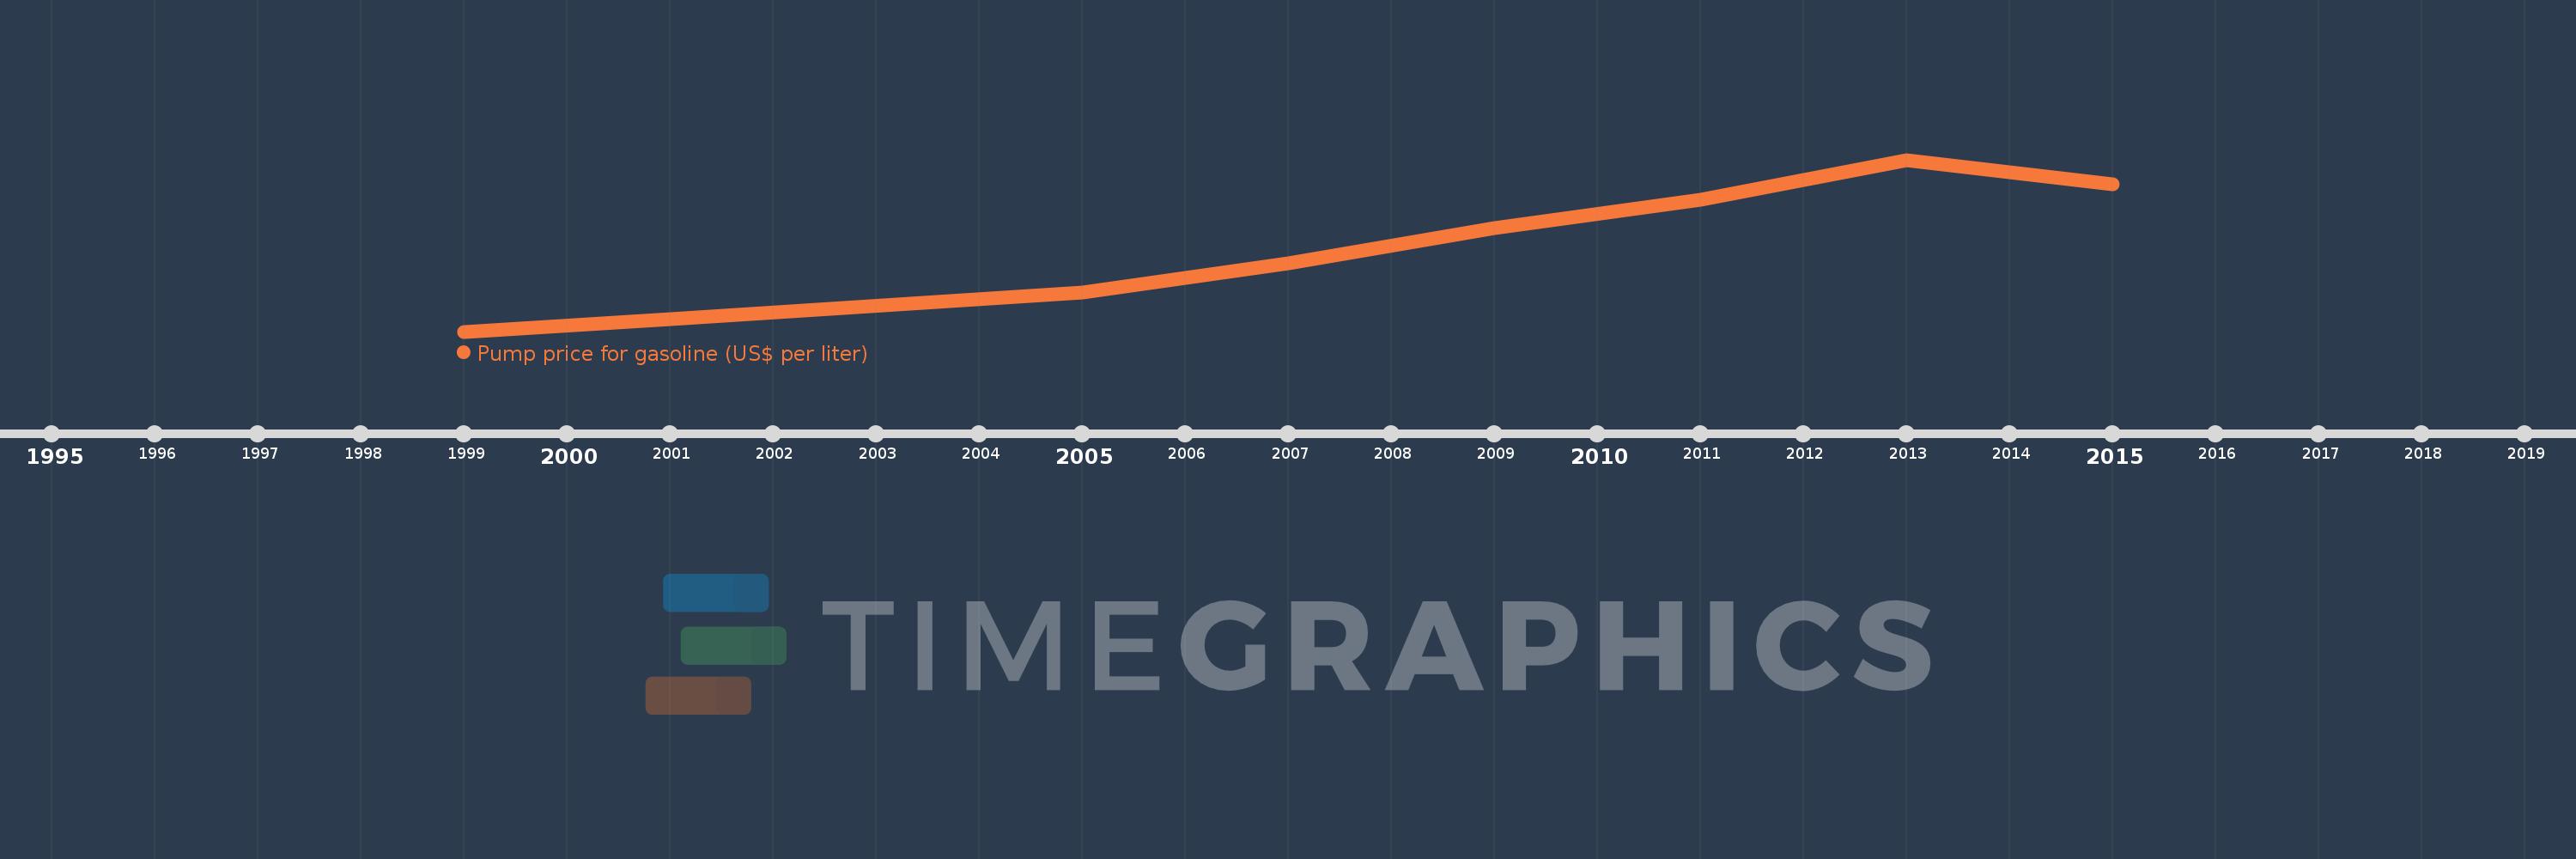
This timeline shows a graph from 1999 to 2015 of East Asia & Pacific (excluding high income). No data until 1998. Number of actual observations by date: 8.
Source name:
World Development Indicators
Source organization:
German Agency for International Cooperation (GIZ).
Categories, topics:
Energy & Mining, Urban Development
Last updated:
apr 23, 2017
Indicators value changes by year
Meaning:
0.802
Minimum:
0.31
jan 1, 1999
Maximum:
1.31
jan 1, 2013
At the date of observation
Value
Absolute change
Change from the previous value
jan 1, 1999
0.31
+0.31
0.0%
jan 1, 2001
0.385
+0.075
24.19%
jan 1, 2005
0.54
+0.155
40.26%
jan 1, 2007
0.71
+0.17
31.48%
jan 1, 2009
0.915
+0.205
28.87%
jan 1, 2011
1.08
+0.165
18.03%
jan 1, 2013
1.31
+0.23
21.3%
jan 1, 2015
1.17
-0.14
-10.69%
Ranking of countries by current statistics by years