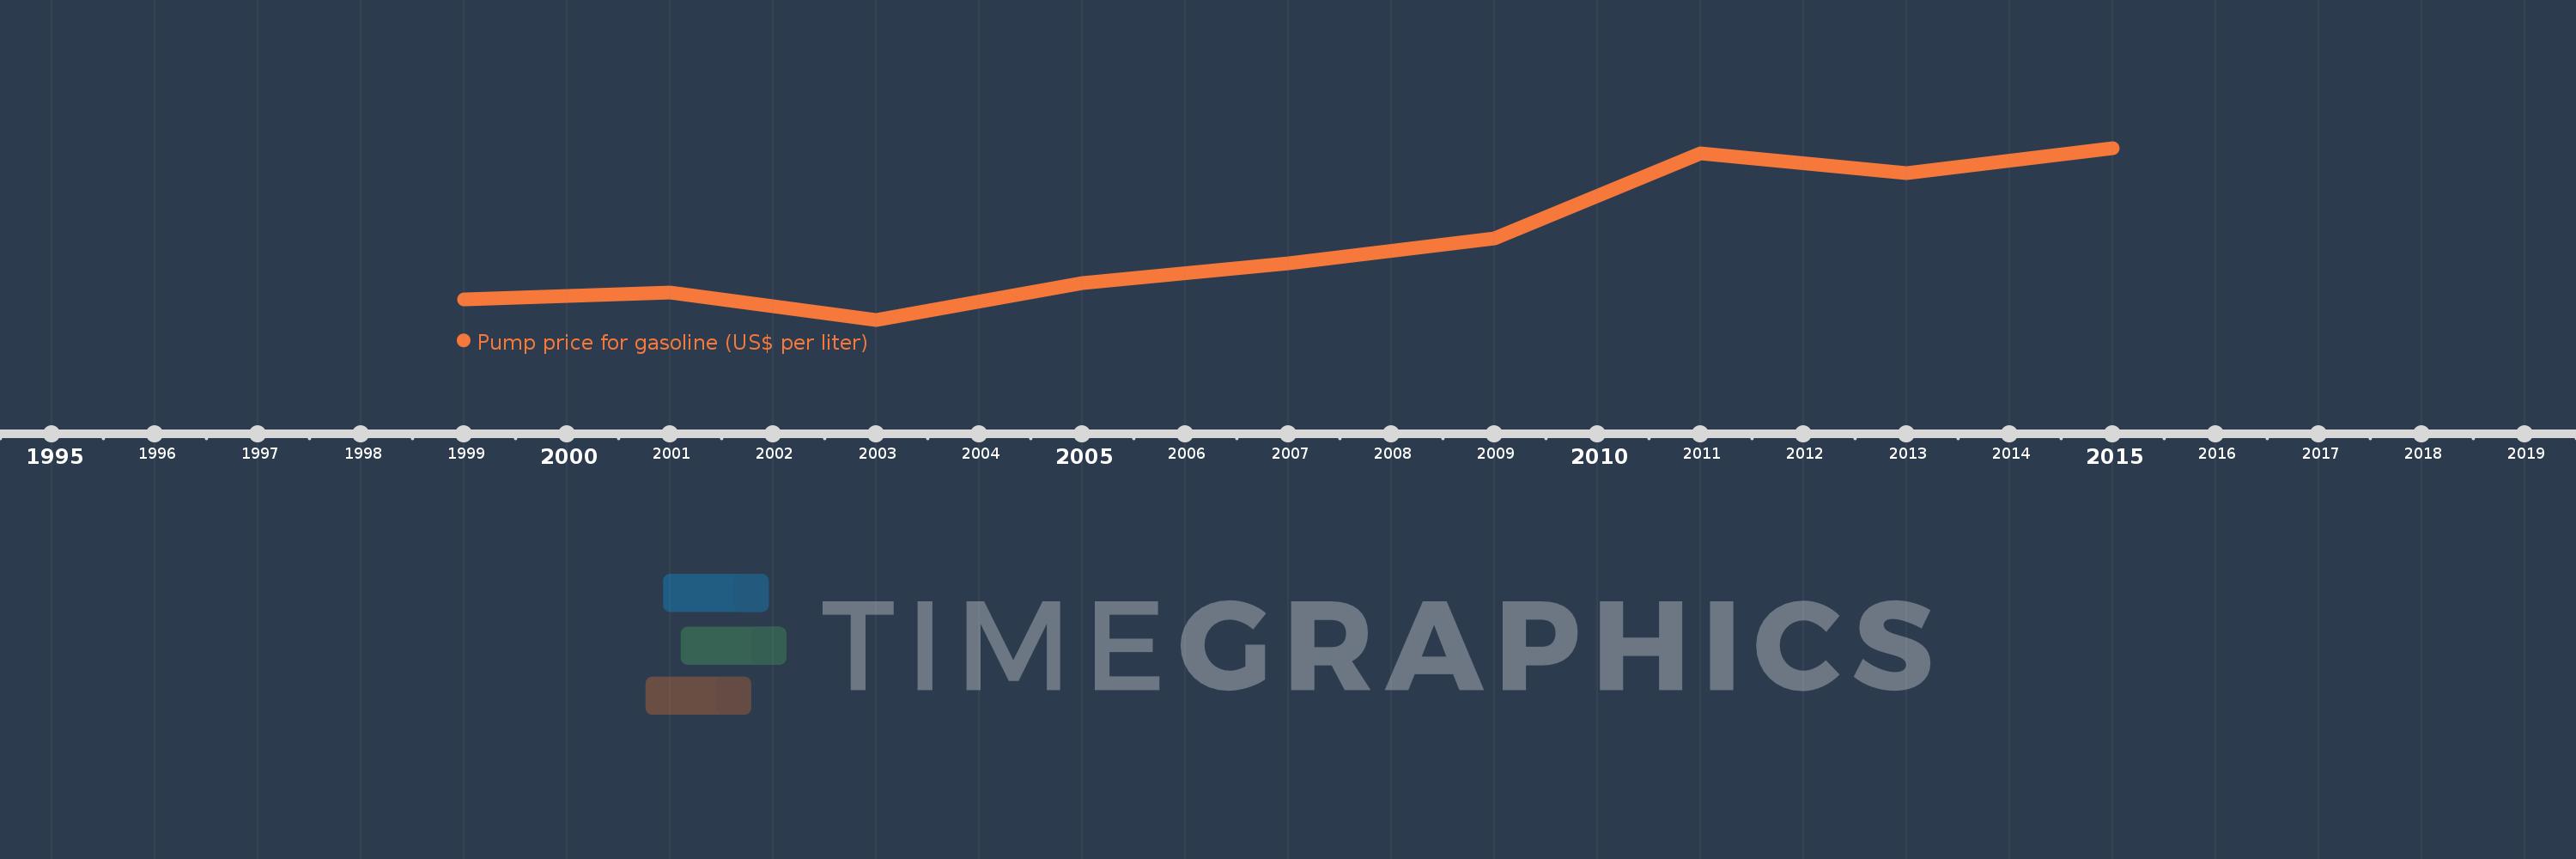
This timeline shows a graph from 1999 to 2015 of Middle East & North Africa (IDA & IBRD countries). No data until 1998. Number of actual observations by date: 9.
Source name:
World Development Indicators
Source organization:
German Agency for International Cooperation (GIZ).
Categories, topics:
Energy & Mining, Urban Development
Last updated:
apr 23, 2017
Indicators value changes by year
Meaning:
0.541
Minimum:
0.255
jan 1, 2003
Maximum:
0.88
jan 1, 2015
At the date of observation
Value
Absolute change
Change from the previous value
jan 1, 1999
0.33
+0.33
0.0%
jan 1, 2001
0.355
+0.025
7.58%
jan 1, 2003
0.255
-0.1
-28.17%
jan 1, 2005
0.39
+0.135
52.94%
jan 1, 2007
0.46
+0.07
17.95%
jan 1, 2009
0.55
+0.09
19.57%
jan 1, 2011
0.86
+0.31
56.36%
jan 1, 2013
0.79
-0.07
-8.14%
jan 1, 2015
0.88
+0.09
11.39%
Ranking of countries by current statistics by years