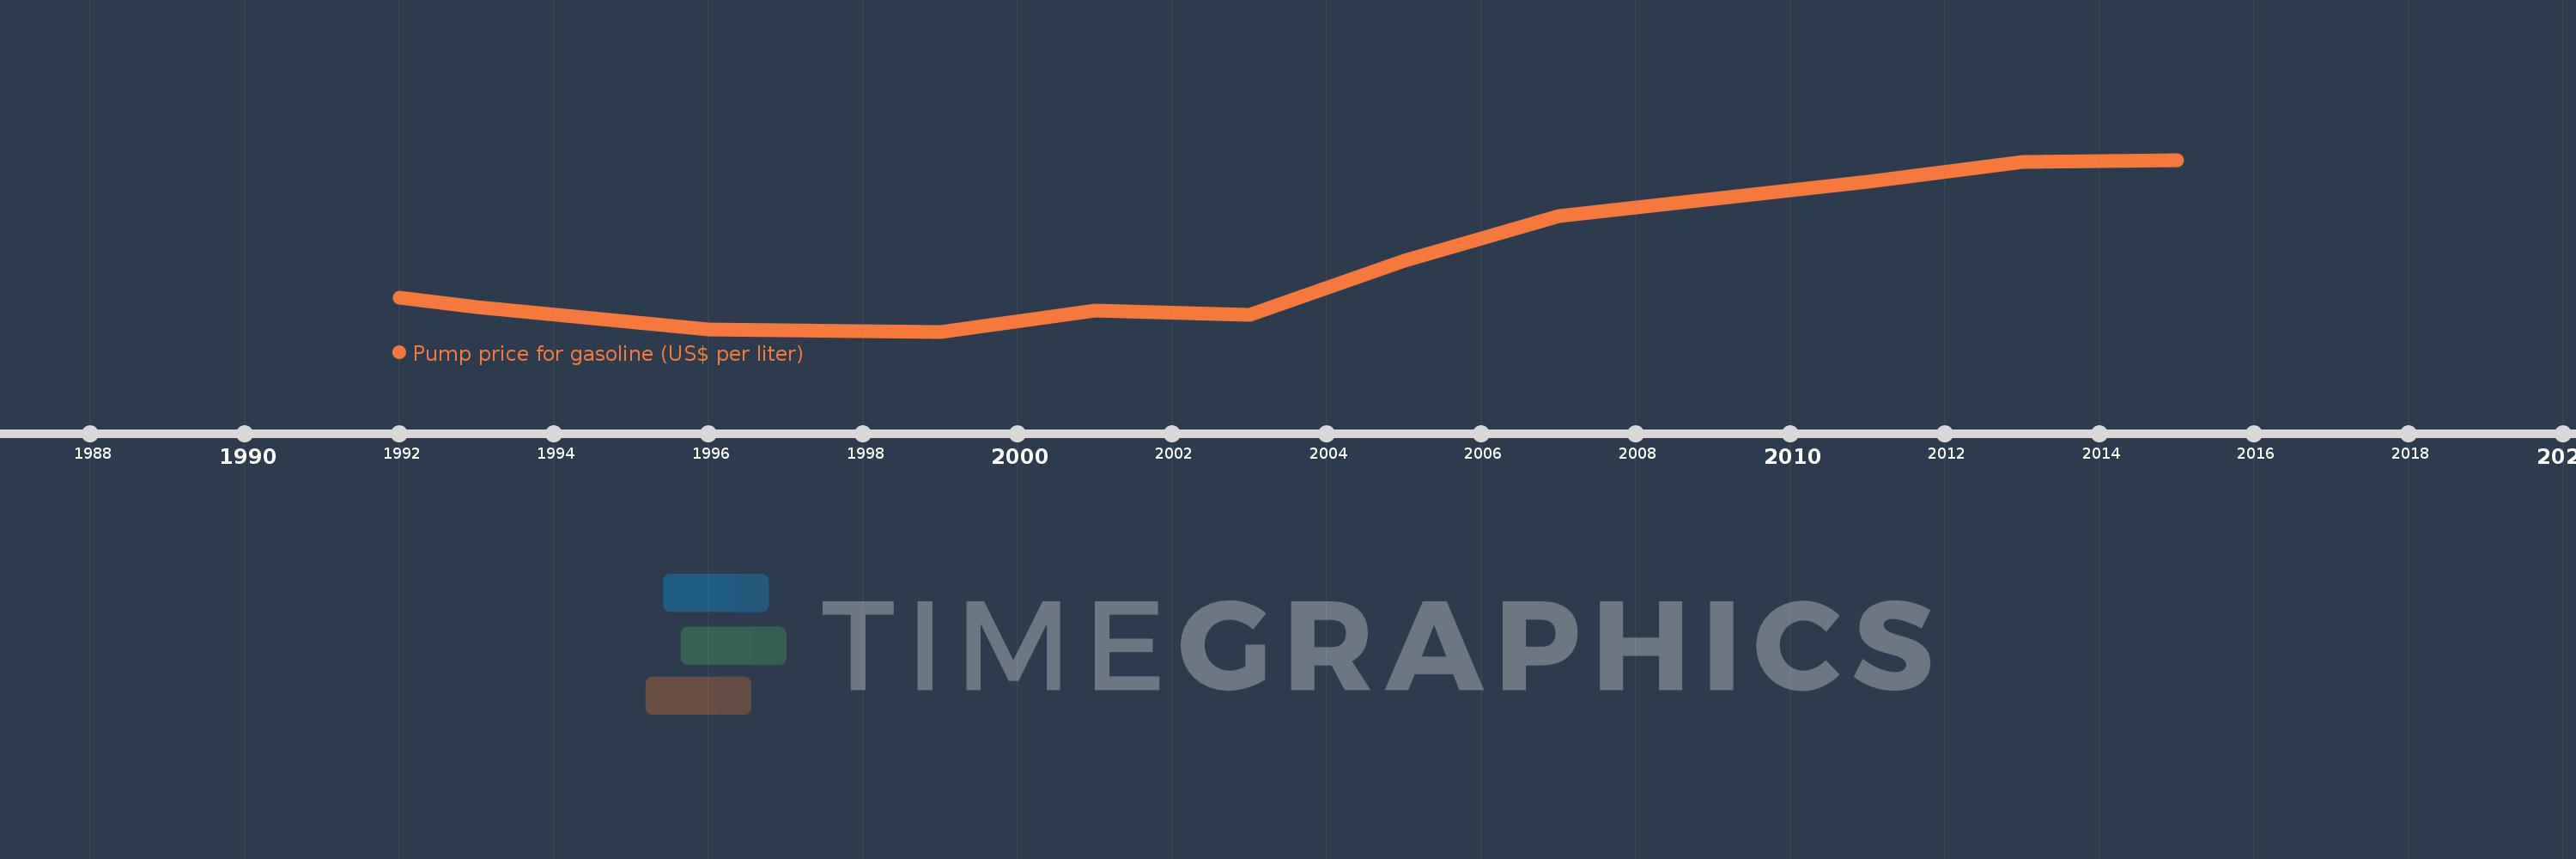
This timeline shows a graph from 1992 to 2015 of Heavily indebted poor countries (HIPC). No data until 1991. Number of actual observations by date: 12.
Source name:
World Development Indicators
Source organization:
German Agency for International Cooperation (GIZ).
Categories, topics:
Energy & Mining, Urban Development
Last updated:
apr 23, 2017
Indicators value changes by year
Meaning:
0.899
Minimum:
0.59
jan 1, 1999
Maximum:
1.29
jan 1, 2015
At the date of observation
Value
Absolute change
Change from the previous value
jan 1, 1992
0.73
+0.73
0.0%
jan 1, 1993
0.69
-0.04
-5.48%
jan 1, 1996
0.6
-0.09
-13.04%
jan 1, 1999
0.59
-0.01
-1.67%
jan 1, 2001
0.675
+0.085
14.41%
jan 1, 2003
0.66
-0.015
-2.22%
jan 1, 2005
0.88
+0.22
33.33%
jan 1, 2007
1.06
+0.18
20.45%
jan 1, 2009
1.13
+0.07
6.6%
jan 1, 2011
1.2
+0.07
6.19%
jan 1, 2013
1.28
+0.08
6.67%
jan 1, 2015
1.29
+0.01
0.78%
Ranking of countries by current statistics by years