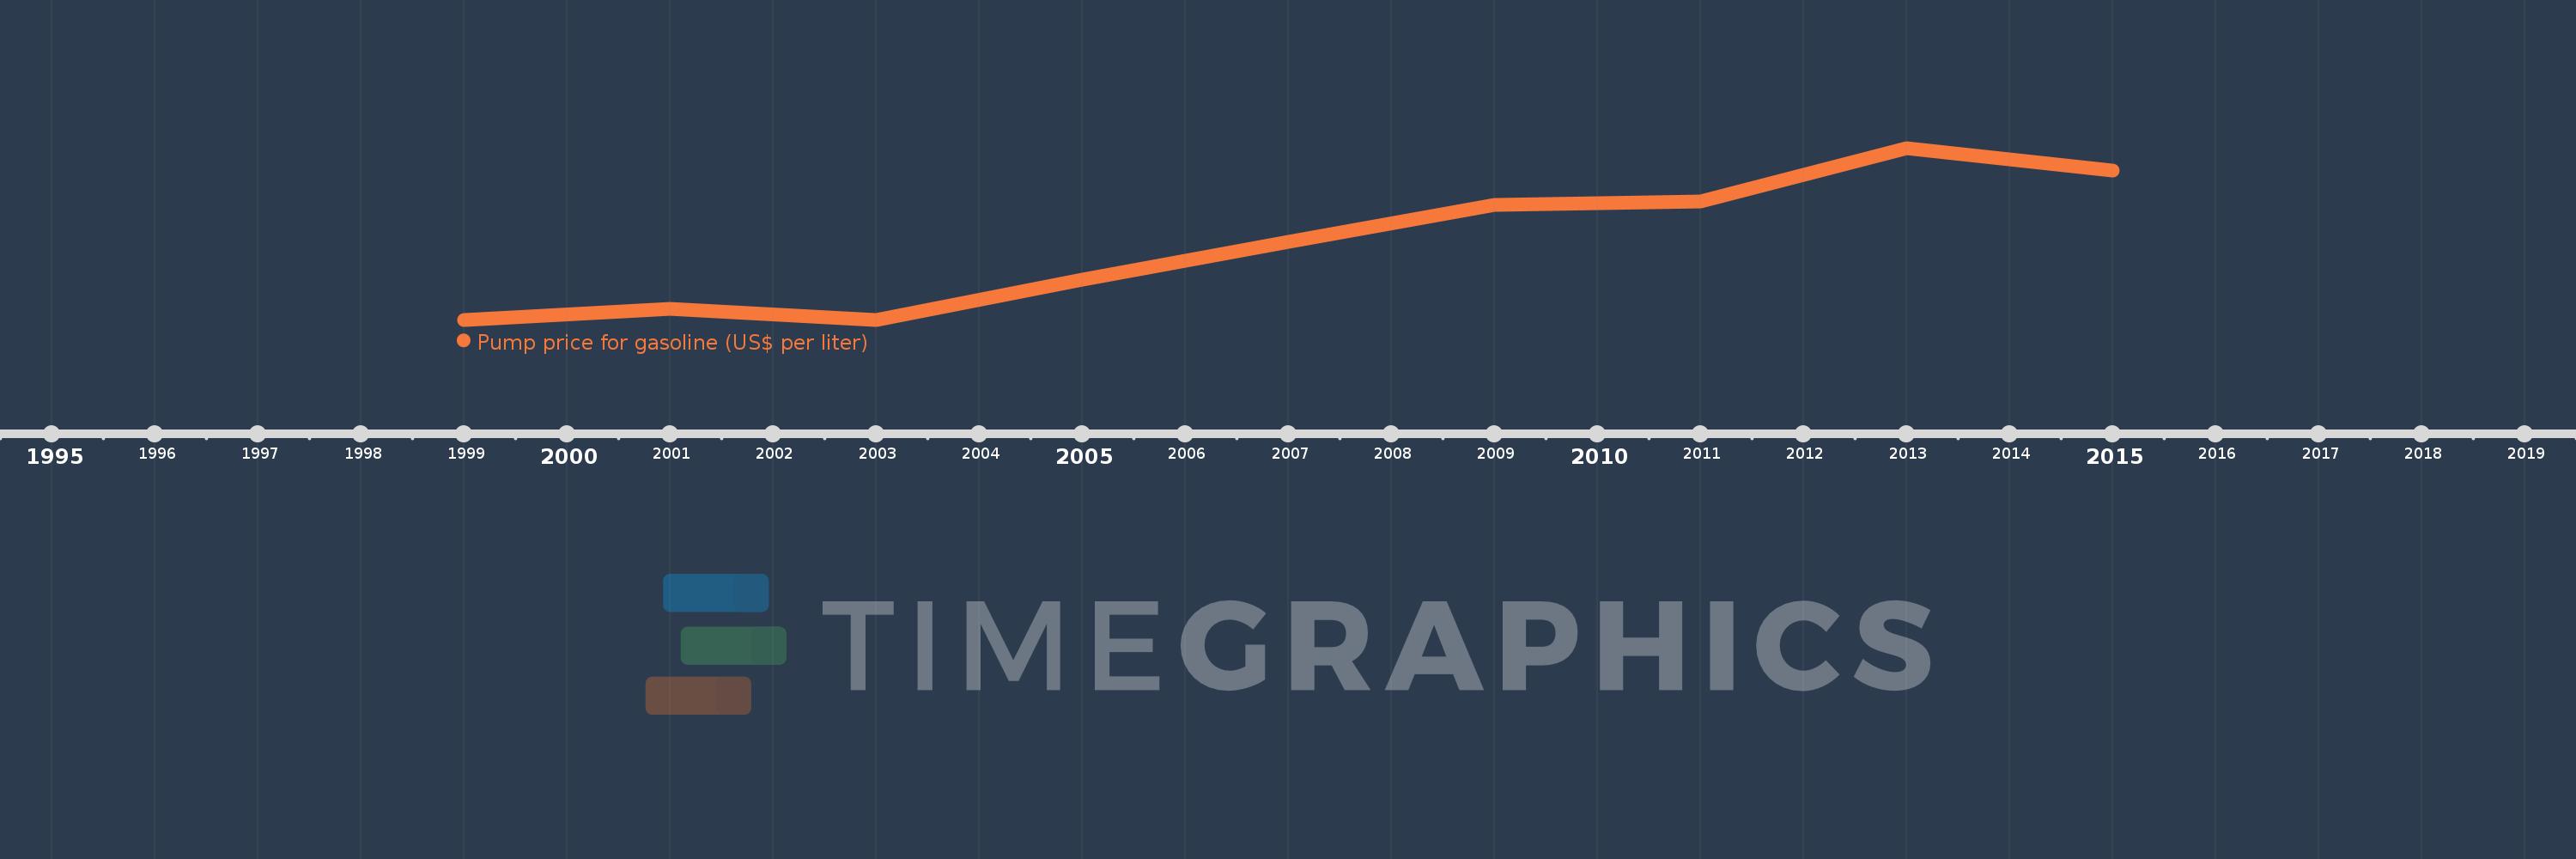
This timeline shows a graph from 1999 to 2015 of Europe & Central Asia (excluding high income). No data until 1998. Number of actual observations by date: 9.
Source name:
World Development Indicators
Source organization:
German Agency for International Cooperation (GIZ).
Categories, topics:
Energy & Mining, Urban Development
Last updated:
apr 23, 2017
Indicators value changes by year
Meaning:
0.901
Minimum:
0.49
jan 1, 1999
Maximum:
1.42
jan 1, 2013
At the date of observation
Value
Absolute change
Change from the previous value
jan 1, 1999
0.49
+0.49
0.0%
jan 1, 2001
0.55
+0.06
12.24%
jan 1, 2003
0.49
-0.06
-10.91%
jan 1, 2005
0.705
+0.215
43.88%
jan 1, 2007
0.91
+0.205
29.08%
jan 1, 2009
1.11
+0.2
21.98%
jan 1, 2011
1.13
+0.02
1.8%
jan 1, 2013
1.42
+0.29
25.66%
jan 1, 2015
1.3
-0.12
-8.45%
Ranking of countries by current statistics by years