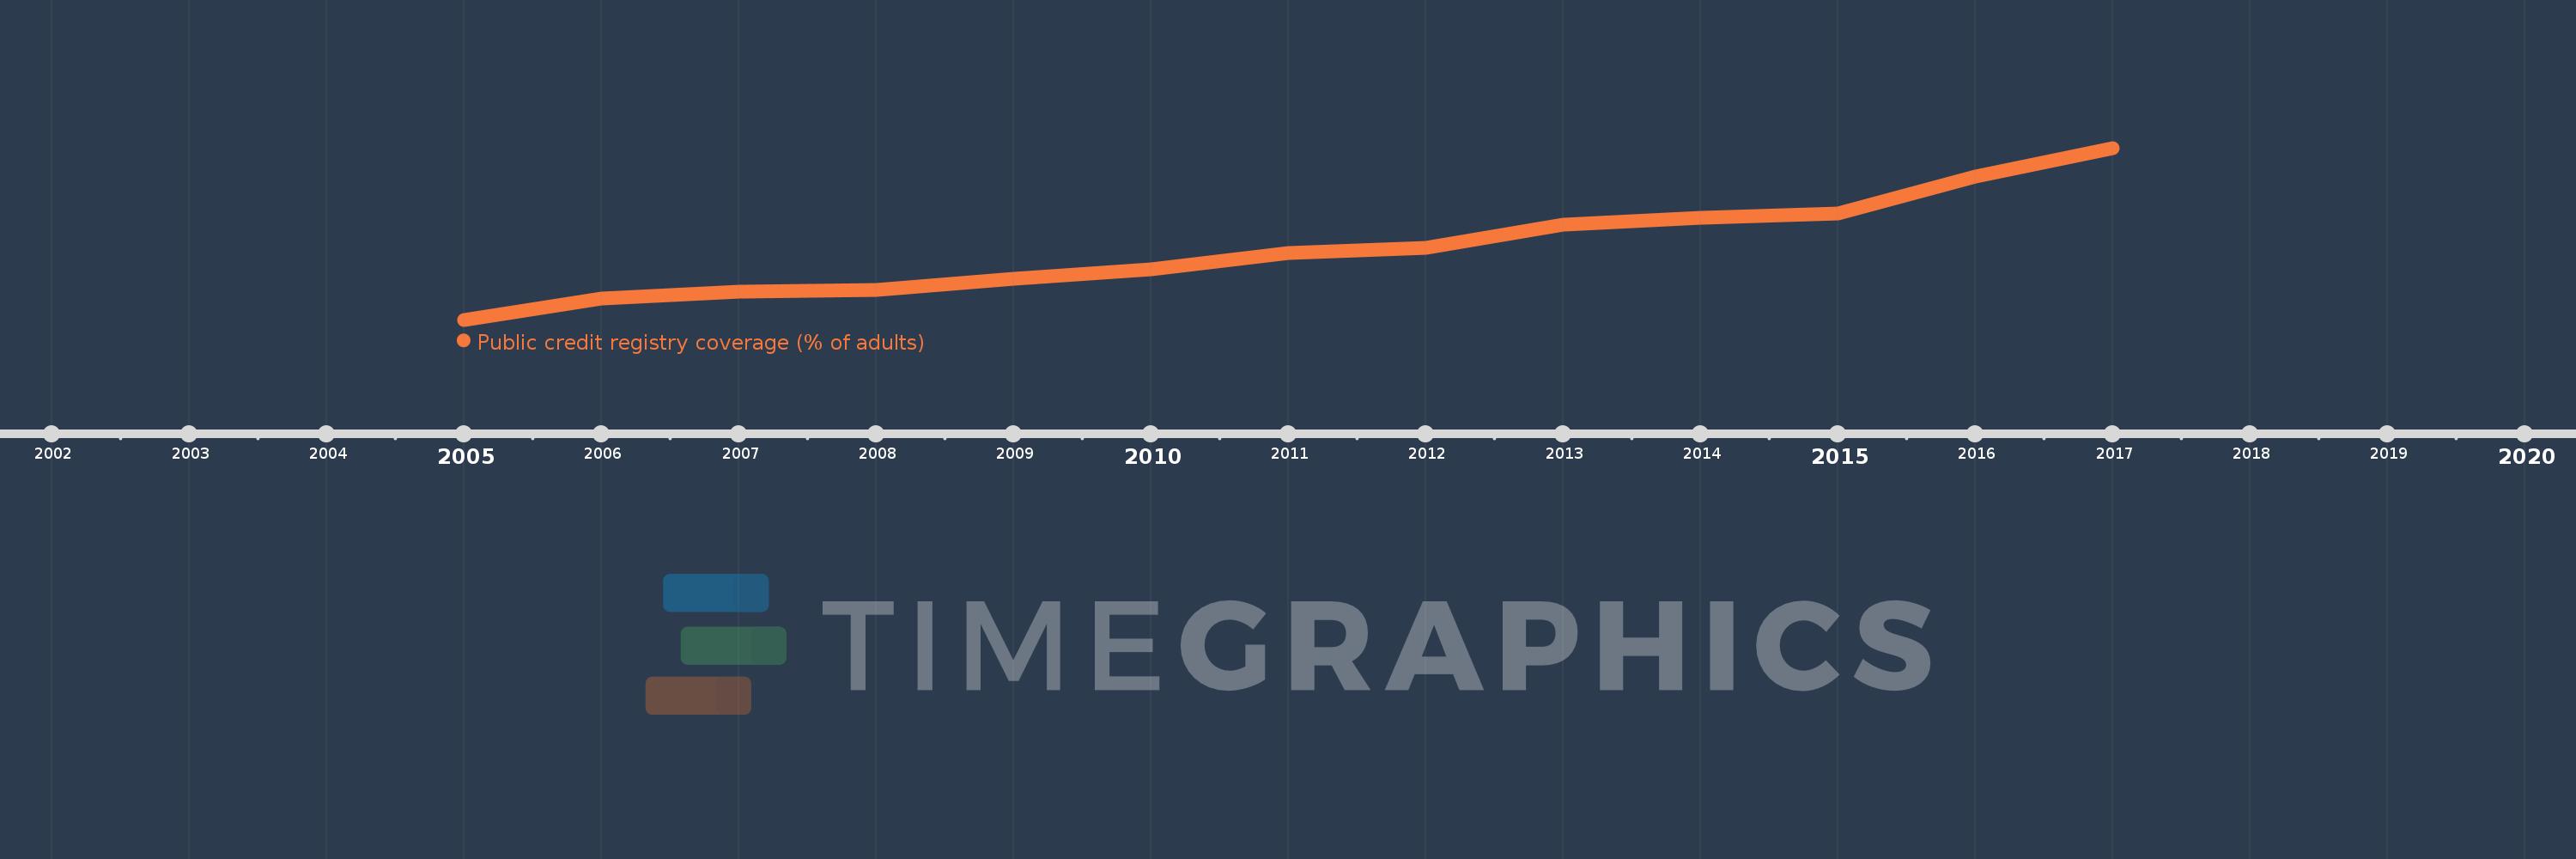
This timeline shows a graph from 2005 to 2017 of Sub-Saharan Africa (IDA & IBRD countries). No data until 2004. Number of actual observations by date: 13.
Source name:
World Development Indicators
Source organization:
World Bank, Doing Business project (http://www.doingbusiness.org/).
Categories, topics:
Financial Sector, Private Sector, Public Sector
Last updated:
apr 23, 2017
Indicators value changes by year
Meaning:
2.95
Minimum:
0.135
jan 1, 2005
Maximum:
6.915
jan 1, 2017
At the date of observation
Value
Absolute change
Change from the previous value
jan 1, 2005
0.135
+0.135
0.0%
jan 1, 2006
0.96
+0.825
610.4%
jan 1, 2007
1.239
+0.279
29.08%
jan 1, 2008
1.309
+0.07
5.61%
jan 1, 2009
1.757
+0.448
34.22%
jan 1, 2010
2.13
+0.374
21.29%
jan 1, 2011
2.761
+0.63
29.59%
jan 1, 2012
2.989
+0.228
8.27%
jan 1, 2013
3.887
+0.898
30.05%
jan 1, 2014
4.145
+0.257
6.62%
jan 1, 2015
4.332
+0.187
4.52%
jan 1, 2016
5.787
+1.455
33.6%
jan 1, 2017
6.915
+1.127
19.48%
Ranking of countries by current statistics by years