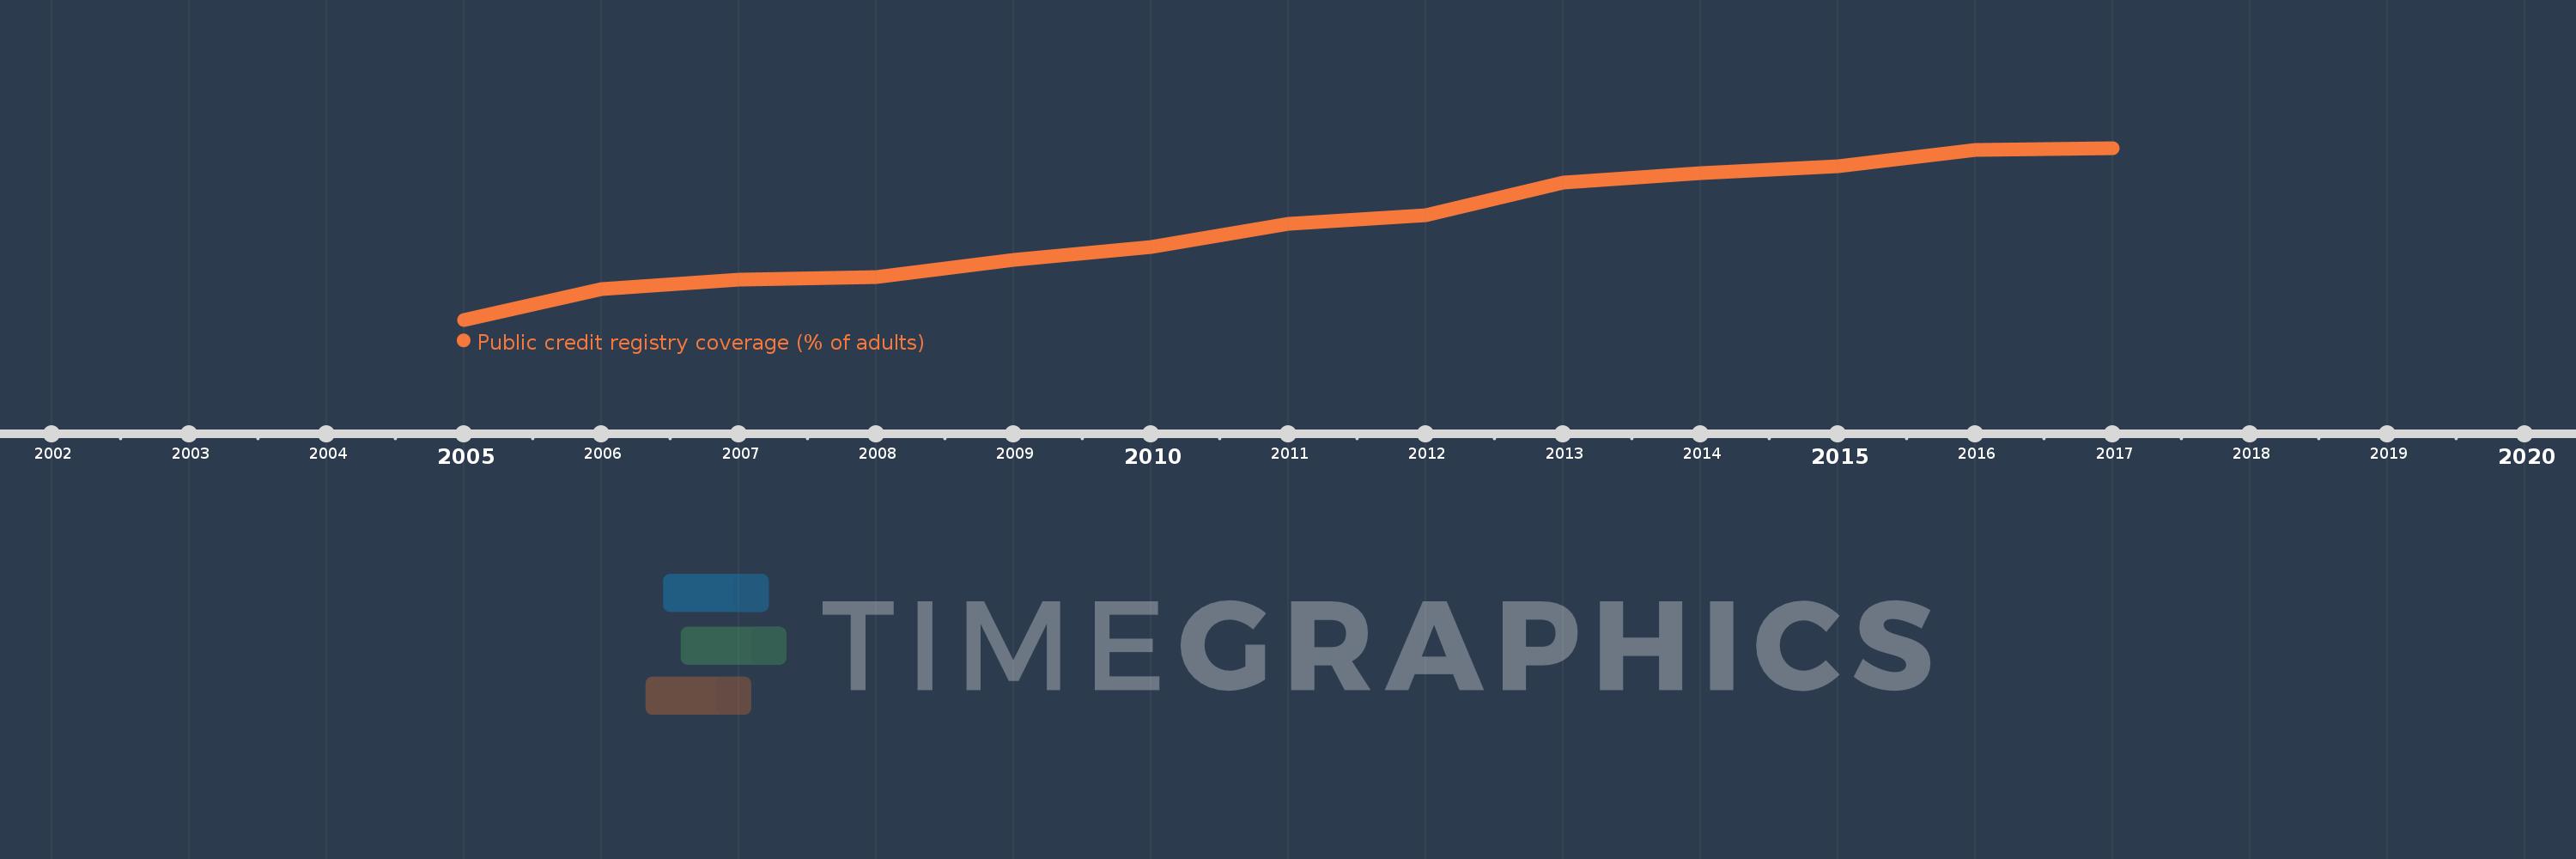
This timeline shows a graph from 2005 to 2017 of Sub-Saharan Africa (excluding high income). No data until 2004. Number of actual observations by date: 13.
Source name:
World Development Indicators
Source organization:
World Bank, Doing Business project (http://www.doingbusiness.org/).
Categories, topics:
Financial Sector, Private Sector, Public Sector
Last updated:
apr 23, 2017
Indicators value changes by year
Meaning:
2.771
Minimum:
0.135
jan 1, 2005
Maximum:
4.934
jan 1, 2017
At the date of observation
Value
Absolute change
Change from the previous value
jan 1, 2005
0.135
+0.135
0.0%
jan 1, 2006
0.982
+0.847
626.55%
jan 1, 2007
1.267
+0.285
29.01%
jan 1, 2008
1.338
+0.071
5.61%
jan 1, 2009
1.796
+0.458
34.22%
jan 1, 2010
2.178
+0.382
21.29%
jan 1, 2011
2.822
+0.644
29.59%
jan 1, 2012
3.056
+0.233
8.27%
jan 1, 2013
3.972
+0.916
29.98%
jan 1, 2014
4.235
+0.263
6.62%
jan 1, 2015
4.426
+0.191
4.52%
jan 1, 2016
4.88
+0.454
10.27%
jan 1, 2017
4.934
+0.054
1.1%
Ranking of countries by current statistics by years