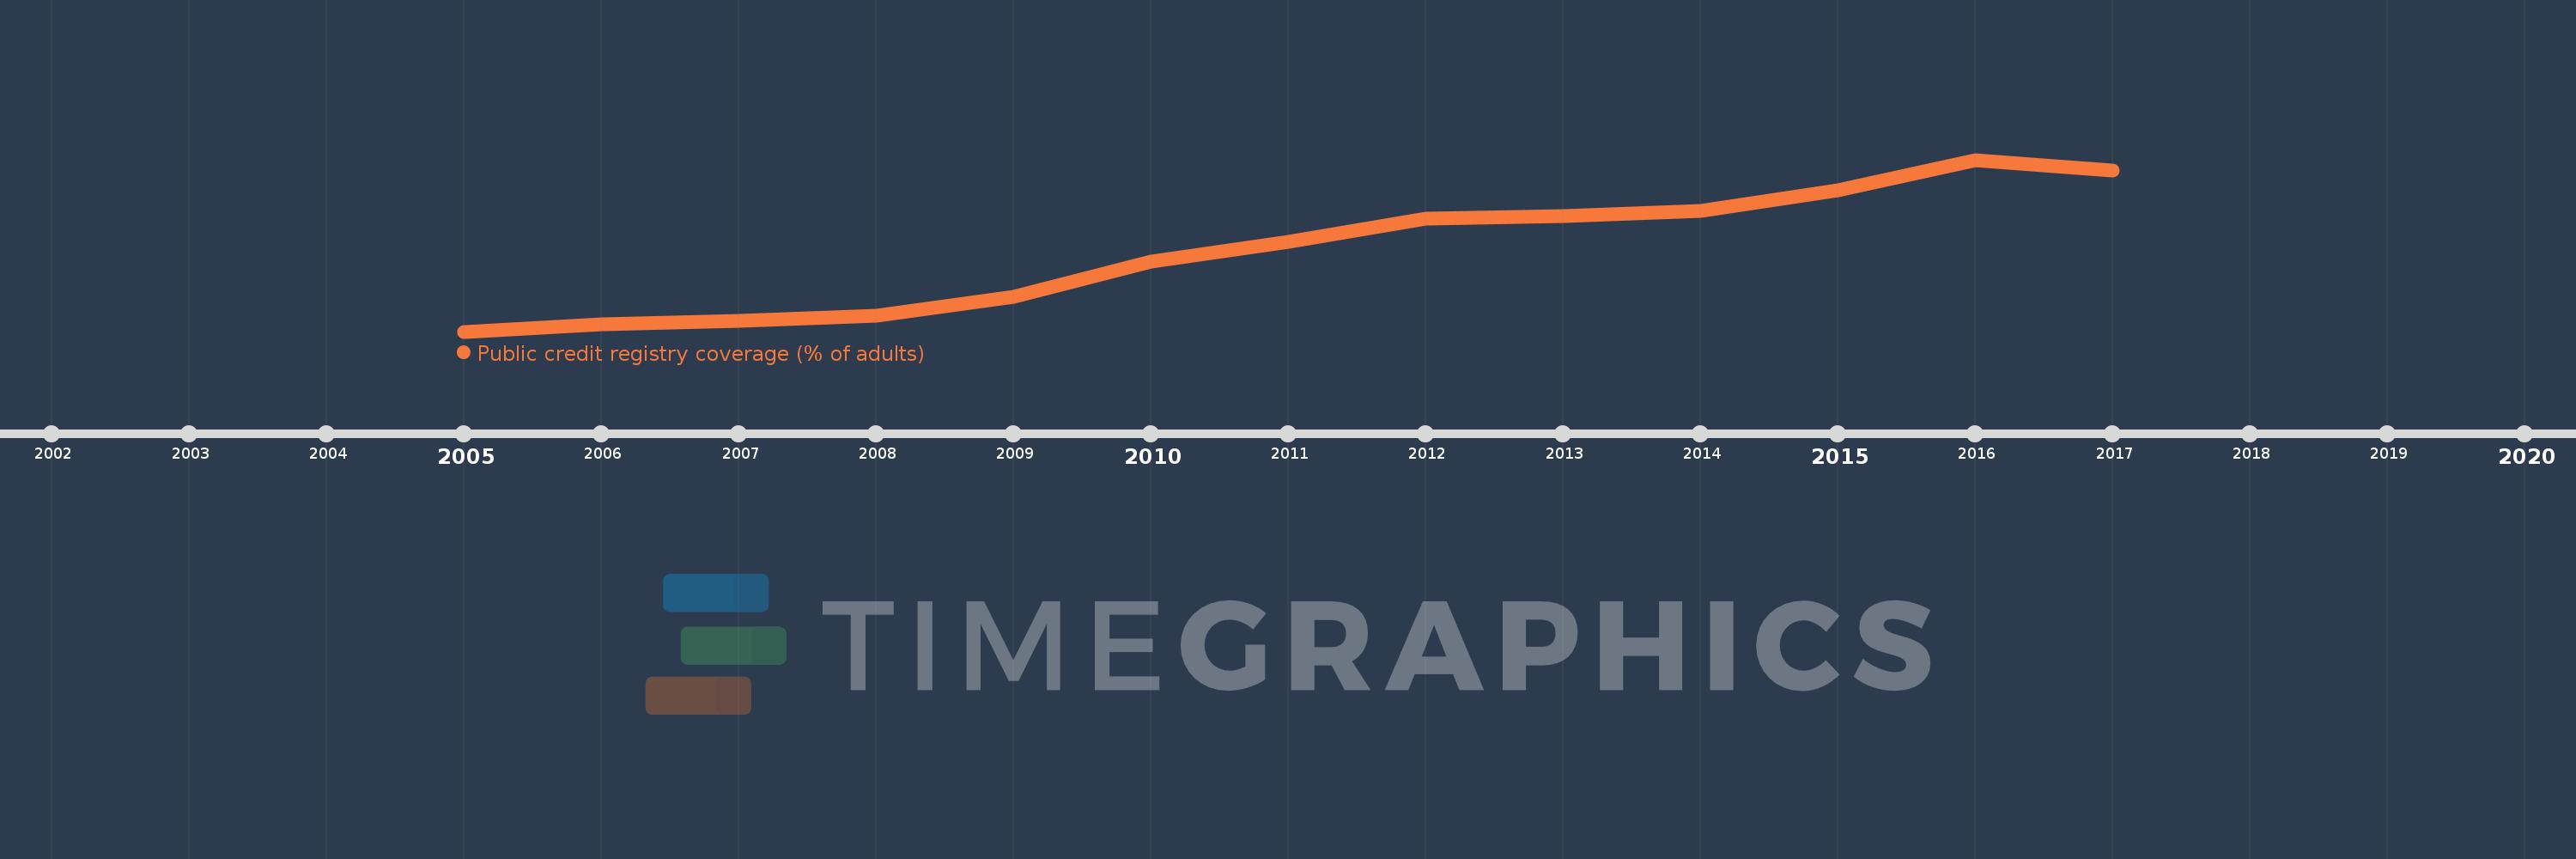
This timeline shows a graph from 2005 to 2017 of Europe & Central Asia (IDA & IBRD countries). No data until 2004. Number of actual observations by date: 13.
Source name:
World Development Indicators
Source organization:
World Bank, Doing Business project (http://www.doingbusiness.org/).
Categories, topics:
Financial Sector, Private Sector, Public Sector
Last updated:
apr 23, 2017
Indicators value changes by year
Meaning:
10.489
Minimum:
0.353
jan 1, 2005
Maximum:
21.85
jan 1, 2016
At the date of observation
Value
Absolute change
Change from the previous value
jan 1, 2005
0.353
+0.353
0.0%
jan 1, 2006
1.3
+0.947
268.66%
jan 1, 2007
1.71
+0.41
31.5%
jan 1, 2008
2.343
+0.633
37.05%
jan 1, 2009
4.662
+2.319
98.98%
jan 1, 2010
9.155
+4.493
96.37%
jan 1, 2011
11.623
+2.468
26.96%
jan 1, 2012
14.505
+2.882
24.79%
jan 1, 2013
14.832
+0.327
2.26%
jan 1, 2014
15.423
+0.591
3.98%
jan 1, 2015
18.05
+2.627
17.04%
jan 1, 2016
21.85
+3.8
21.05%
jan 1, 2017
20.555
-1.295
-5.93%
Ranking of countries by current statistics by years