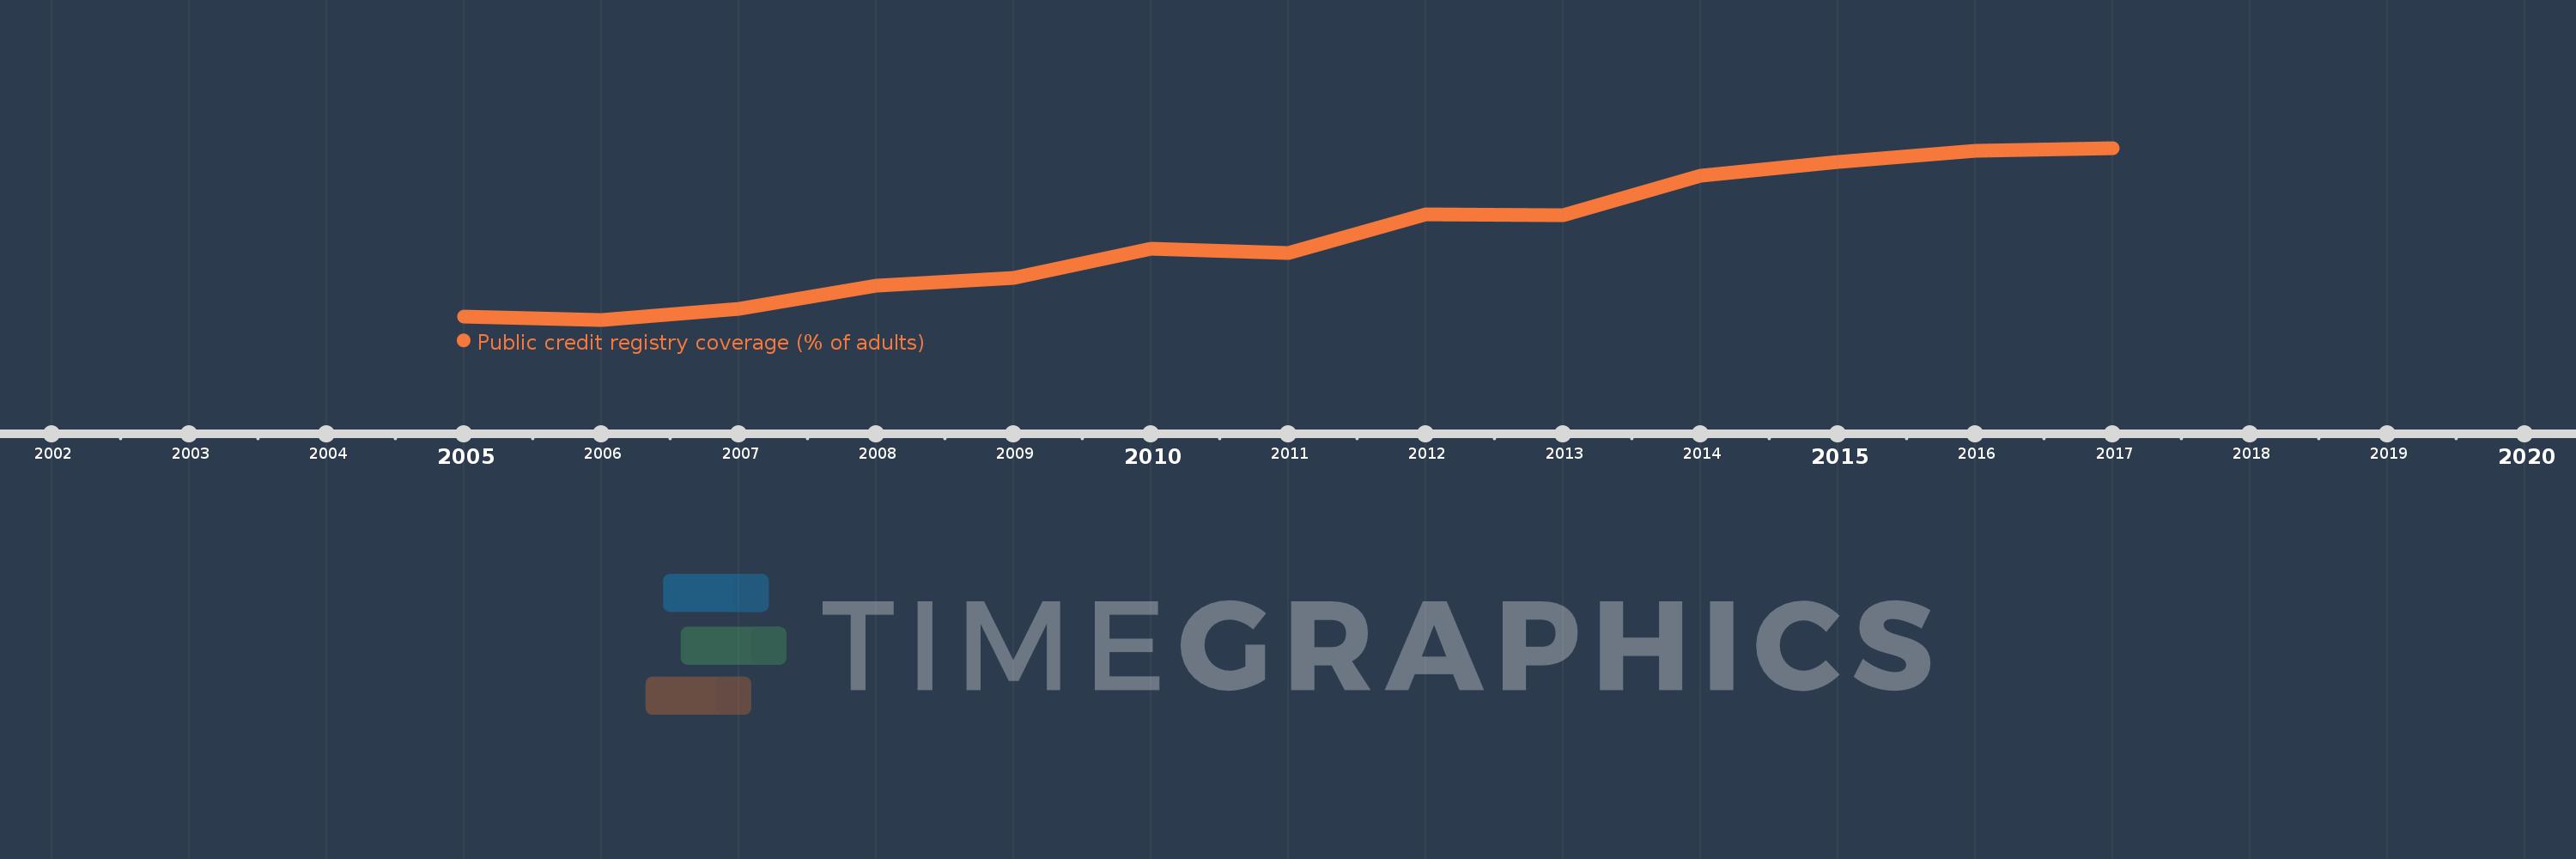
This timeline shows a graph from 2005 to 2017 of Middle East & North Africa (IDA & IBRD countries). No data until 2004. Number of actual observations by date: 13.
Source name:
World Development Indicators
Source organization:
World Bank, Doing Business project (http://www.doingbusiness.org/).
Categories, topics:
Financial Sector, Private Sector, Public Sector
Last updated:
apr 23, 2017
Indicators value changes by year
Meaning:
6.321
Minimum:
2.682
jan 1, 2006
Maximum:
10.208
jan 1, 2017
At the date of observation
Value
Absolute change
Change from the previous value
jan 1, 2005
2.82
+2.82
0.0%
jan 1, 2006
2.682
-0.138
-4.9%
jan 1, 2007
3.145
+0.464
17.29%
jan 1, 2008
4.173
+1.027
32.66%
jan 1, 2009
4.5
+0.327
7.84%
jan 1, 2010
5.782
+1.282
28.48%
jan 1, 2011
5.6
-0.182
-3.14%
jan 1, 2012
7.309
+1.709
30.52%
jan 1, 2013
7.275
-0.034
-0.47%
jan 1, 2014
9.008
+1.733
23.83%
jan 1, 2015
9.6
+0.592
6.57%
jan 1, 2016
10.075
+0.475
4.95%
jan 1, 2017
10.208
+0.133
1.32%
Ranking of countries by current statistics by years