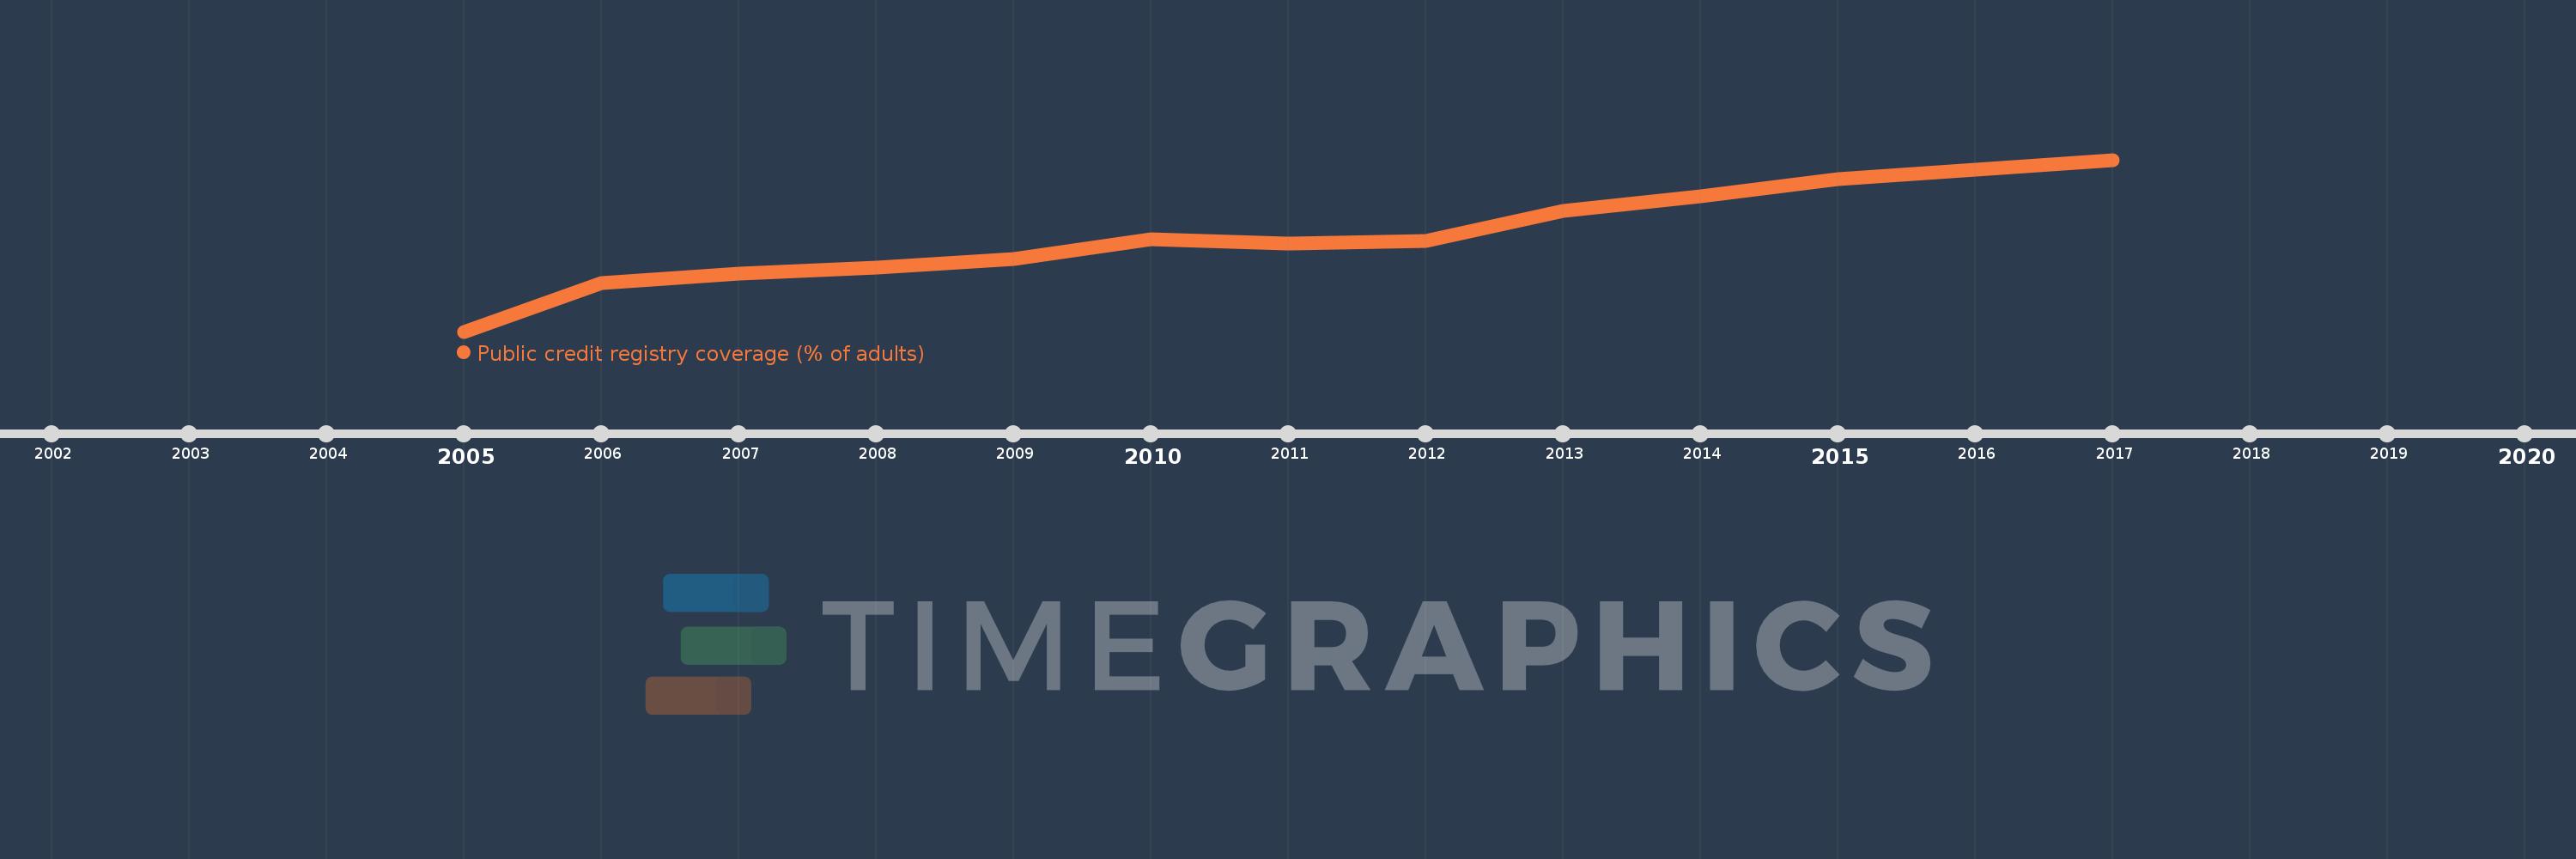
This timeline shows a graph from 2005 to 2017 of Heavily indebted poor countries (HIPC). No data until 2004. Number of actual observations by date: 13.
Source name:
World Development Indicators
Source organization:
World Bank, Doing Business project (http://www.doingbusiness.org/).
Categories, topics:
Financial Sector, Private Sector, Public Sector
Last updated:
apr 23, 2017
Indicators value changes by year
Meaning:
2.134
Minimum:
0.747
jan 1, 2005
Maximum:
3.213
jan 1, 2017
At the date of observation
Value
Absolute change
Change from the previous value
jan 1, 2005
0.747
+0.747
0.0%
jan 1, 2006
1.441
+0.693
92.83%
jan 1, 2007
1.579
+0.138
9.61%
jan 1, 2008
1.668
+0.089
5.67%
jan 1, 2009
1.784
+0.116
6.94%
jan 1, 2010
2.074
+0.289
16.22%
jan 1, 2011
2.011
-0.063
-3.05%
jan 1, 2012
2.047
+0.037
1.83%
jan 1, 2013
2.476
+0.429
20.95%
jan 1, 2014
2.692
+0.216
8.71%
jan 1, 2015
2.932
+0.239
8.9%
jan 1, 2016
3.074
+0.142
4.85%
jan 1, 2017
3.213
+0.139
4.53%
Ranking of countries by current statistics by years