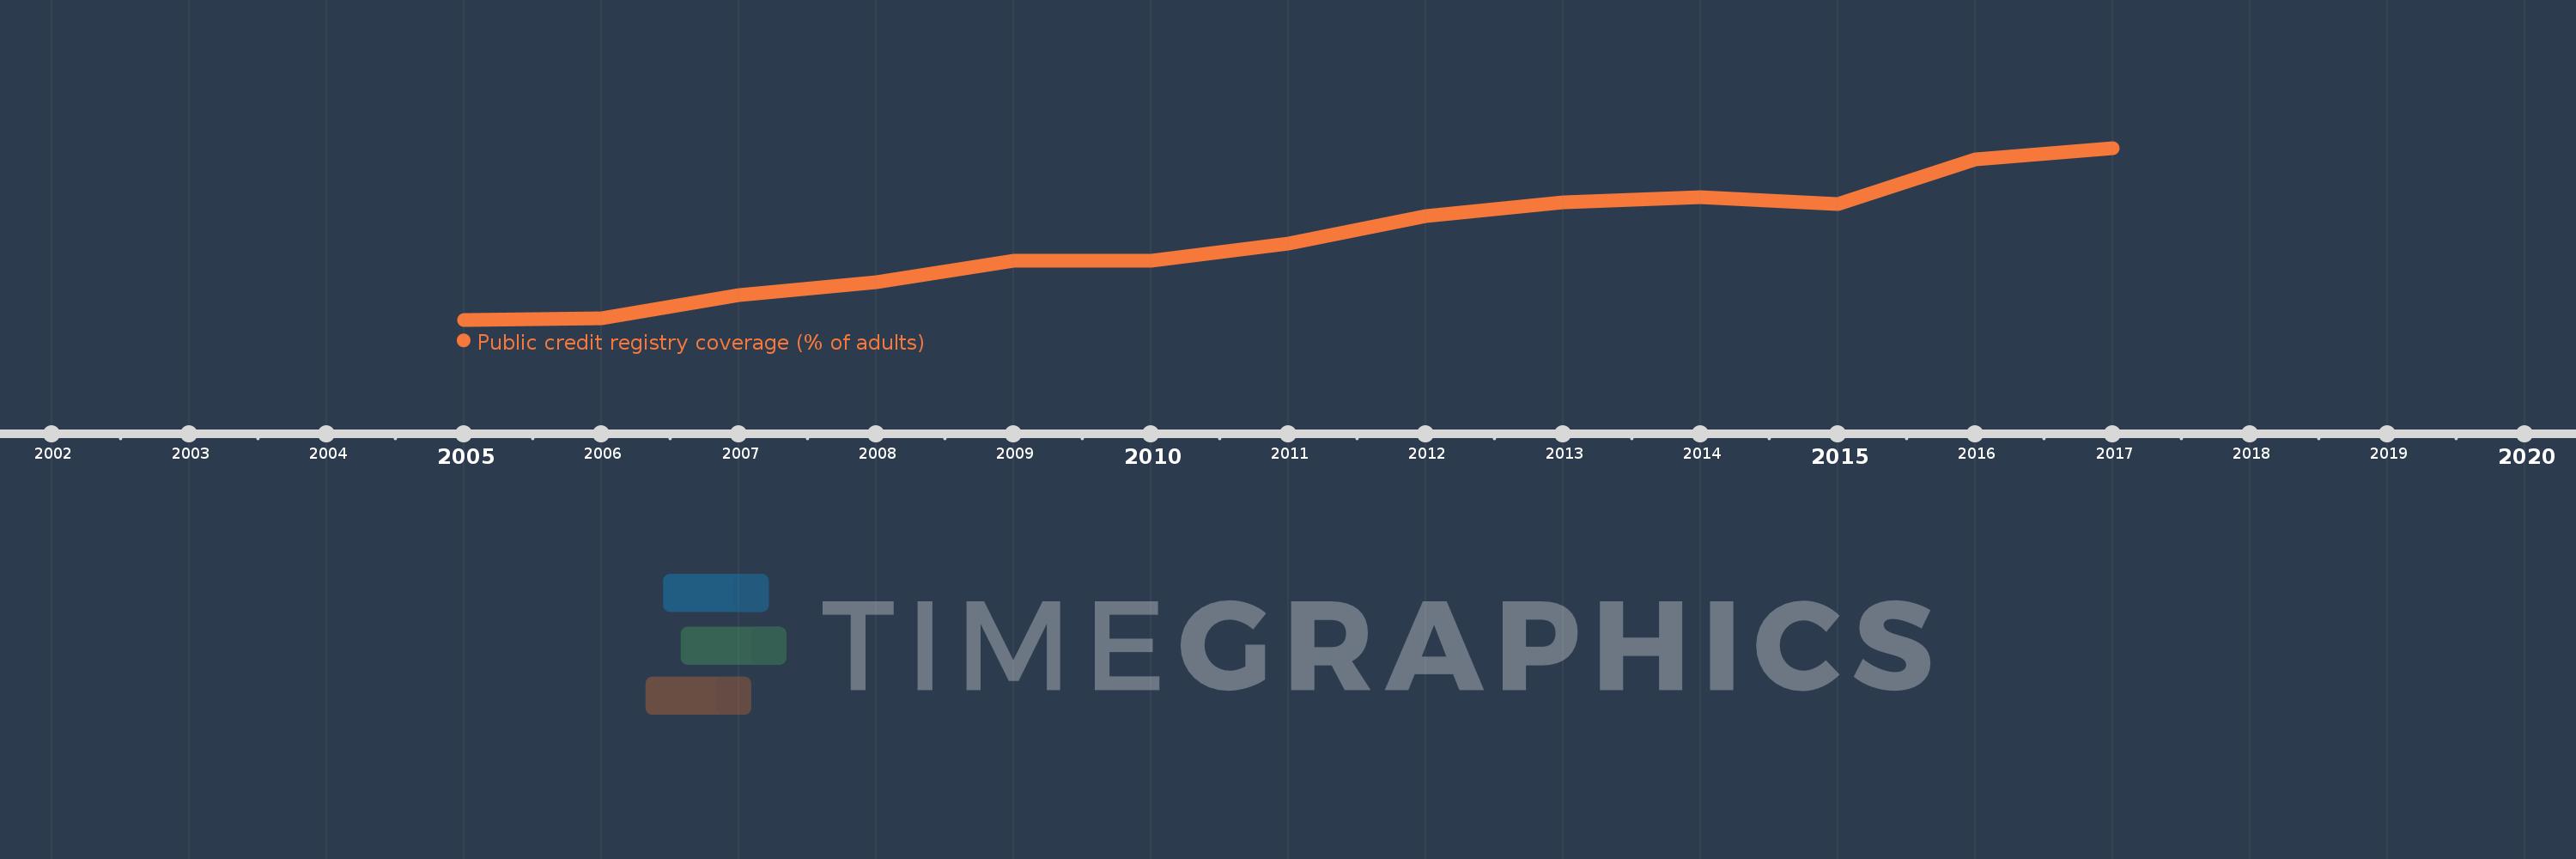
This timeline shows a graph from 2005 to 2017 of East Asia & Pacific (IDA & IBRD countries). No data until 2004. Number of actual observations by date: 13.
Source name:
World Development Indicators
Source organization:
World Bank, Doing Business project (http://www.doingbusiness.org/).
Categories, topics:
Financial Sector, Private Sector, Public Sector
Last updated:
apr 23, 2017
Indicators value changes by year
Meaning:
7.84
Minimum:
1.89
jan 1, 2005
Maximum:
14.562
jan 1, 2017
At the date of observation
Value
Absolute change
Change from the previous value
jan 1, 2005
1.89
+1.89
0.0%
jan 1, 2006
1.995
+0.105
5.56%
jan 1, 2007
3.685
+1.69
84.71%
jan 1, 2008
4.64
+0.955
25.92%
jan 1, 2009
6.26
+1.62
34.91%
jan 1, 2010
6.27
+0.01
0.16%
jan 1, 2011
7.485
+1.215
19.38%
jan 1, 2012
9.52
+2.035
27.19%
jan 1, 2013
10.524
+1.004
10.54%
jan 1, 2014
10.929
+0.405
3.85%
jan 1, 2015
10.452
-0.476
-4.36%
jan 1, 2016
13.71
+3.257
31.16%
jan 1, 2017
14.562
+0.852
6.22%
Ranking of countries by current statistics by years