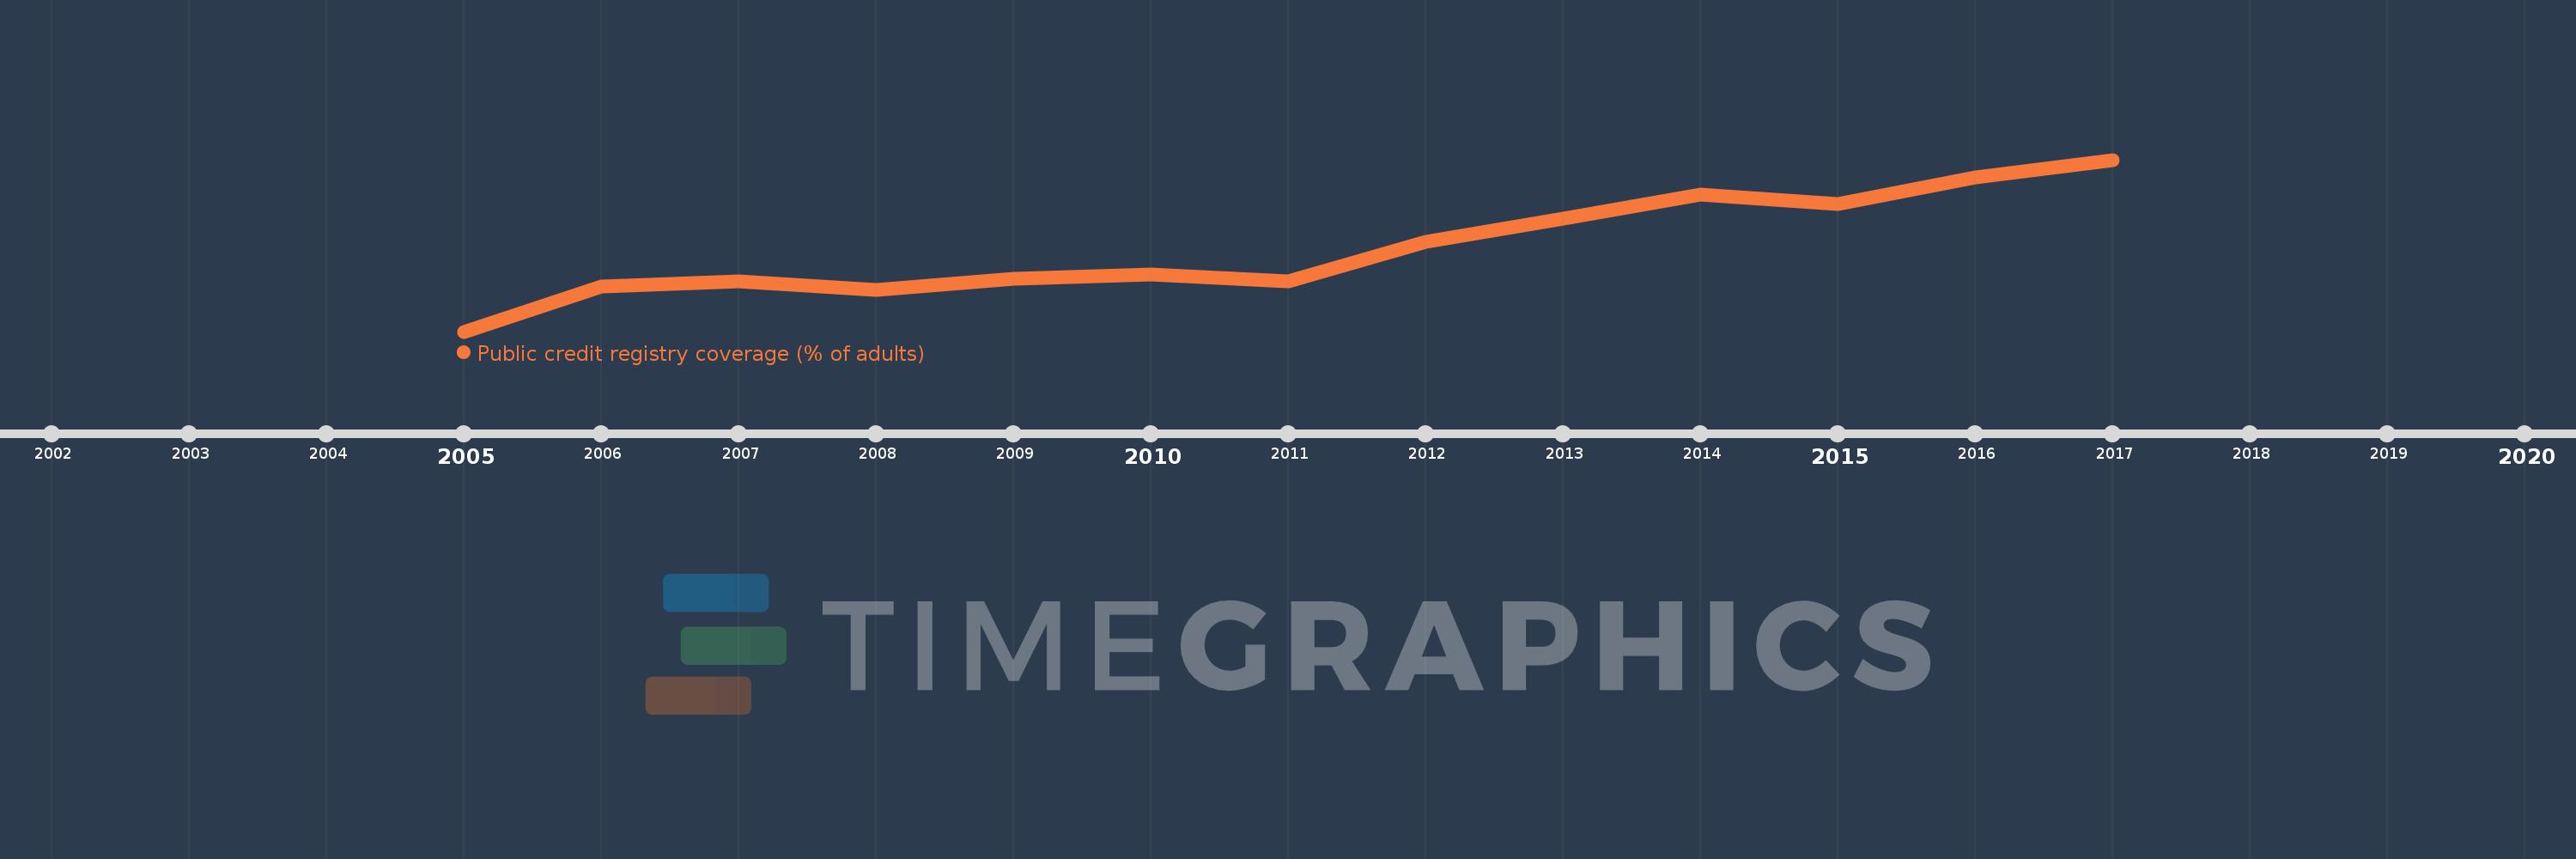
This timeline shows a graph from 2005 to 2017 of Least developed countries: UN classification. No data until 2004. Number of actual observations by date: 13.
Source name:
World Development Indicators
Source organization:
World Bank, Doing Business project (http://www.doingbusiness.org/).
Categories, topics:
Financial Sector, Private Sector, Public Sector
Last updated:
apr 23, 2017
Indicators value changes by year
Meaning:
0.893
Minimum:
0.147
jan 1, 2005
Maximum:
1.674
jan 1, 2017
At the date of observation
Value
Absolute change
Change from the previous value
jan 1, 2005
0.147
+0.147
0.0%
jan 1, 2006
0.549
+0.401
272.43%
jan 1, 2007
0.591
+0.042
7.67%
jan 1, 2008
0.518
-0.073
-12.31%
jan 1, 2009
0.62
+0.102
19.74%
jan 1, 2010
0.655
+0.034
5.49%
jan 1, 2011
0.591
-0.064
-9.72%
jan 1, 2012
0.948
+0.357
60.38%
jan 1, 2013
1.154
+0.207
21.8%
jan 1, 2014
1.361
+0.207
17.89%
jan 1, 2015
1.278
-0.083
-6.07%
jan 1, 2016
1.52
+0.241
18.88%
jan 1, 2017
1.674
+0.155
10.19%
Ranking of countries by current statistics by years