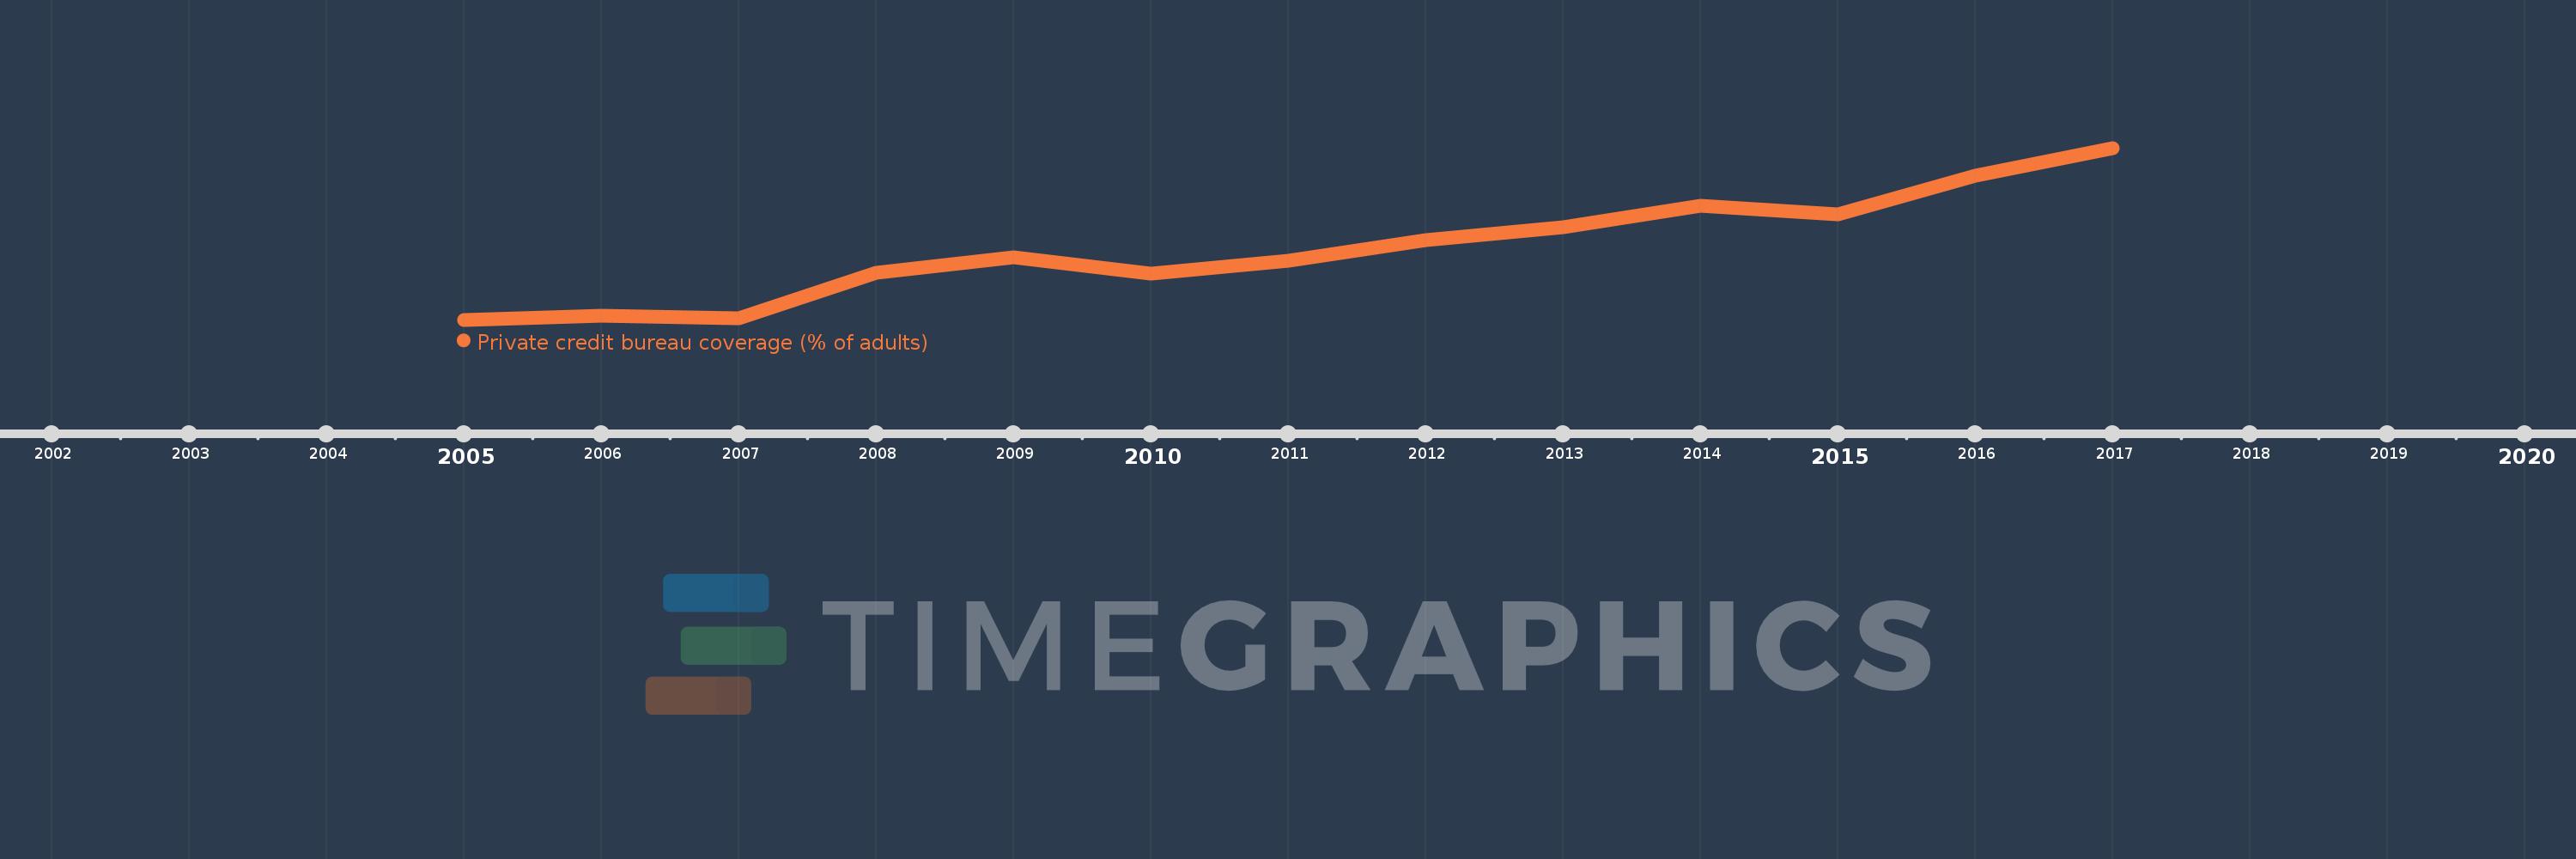
This timeline shows a graph from 2005 to 2017 of Sub-Saharan Africa (IDA & IBRD countries). No data until 2004. Number of actual observations by date: 13.
Source name:
World Development Indicators
Source organization:
World Bank, Doing Business project (http://www.doingbusiness.org/).
Categories, topics:
Financial Sector, Private Sector
Last updated:
apr 23, 2017
Indicators value changes by year
Meaning:
5.693
Minimum:
4.349
jan 1, 2005
Maximum:
7.583
jan 1, 2017
At the date of observation
Value
Absolute change
Change from the previous value
jan 1, 2005
4.349
+4.349
0.0%
jan 1, 2006
4.433
+0.085
1.95%
jan 1, 2007
4.38
-0.053
-1.19%
jan 1, 2008
5.226
+0.846
19.31%
jan 1, 2009
5.522
+0.296
5.66%
jan 1, 2010
5.224
-0.298
-5.39%
jan 1, 2011
5.463
+0.239
4.58%
jan 1, 2012
5.841
+0.378
6.92%
jan 1, 2013
6.096
+0.254
4.36%
jan 1, 2014
6.494
+0.398
6.53%
jan 1, 2015
6.336
-0.157
-2.42%
jan 1, 2016
7.068
+0.732
11.55%
jan 1, 2017
7.583
+0.515
7.29%
Ranking of countries by current statistics by years