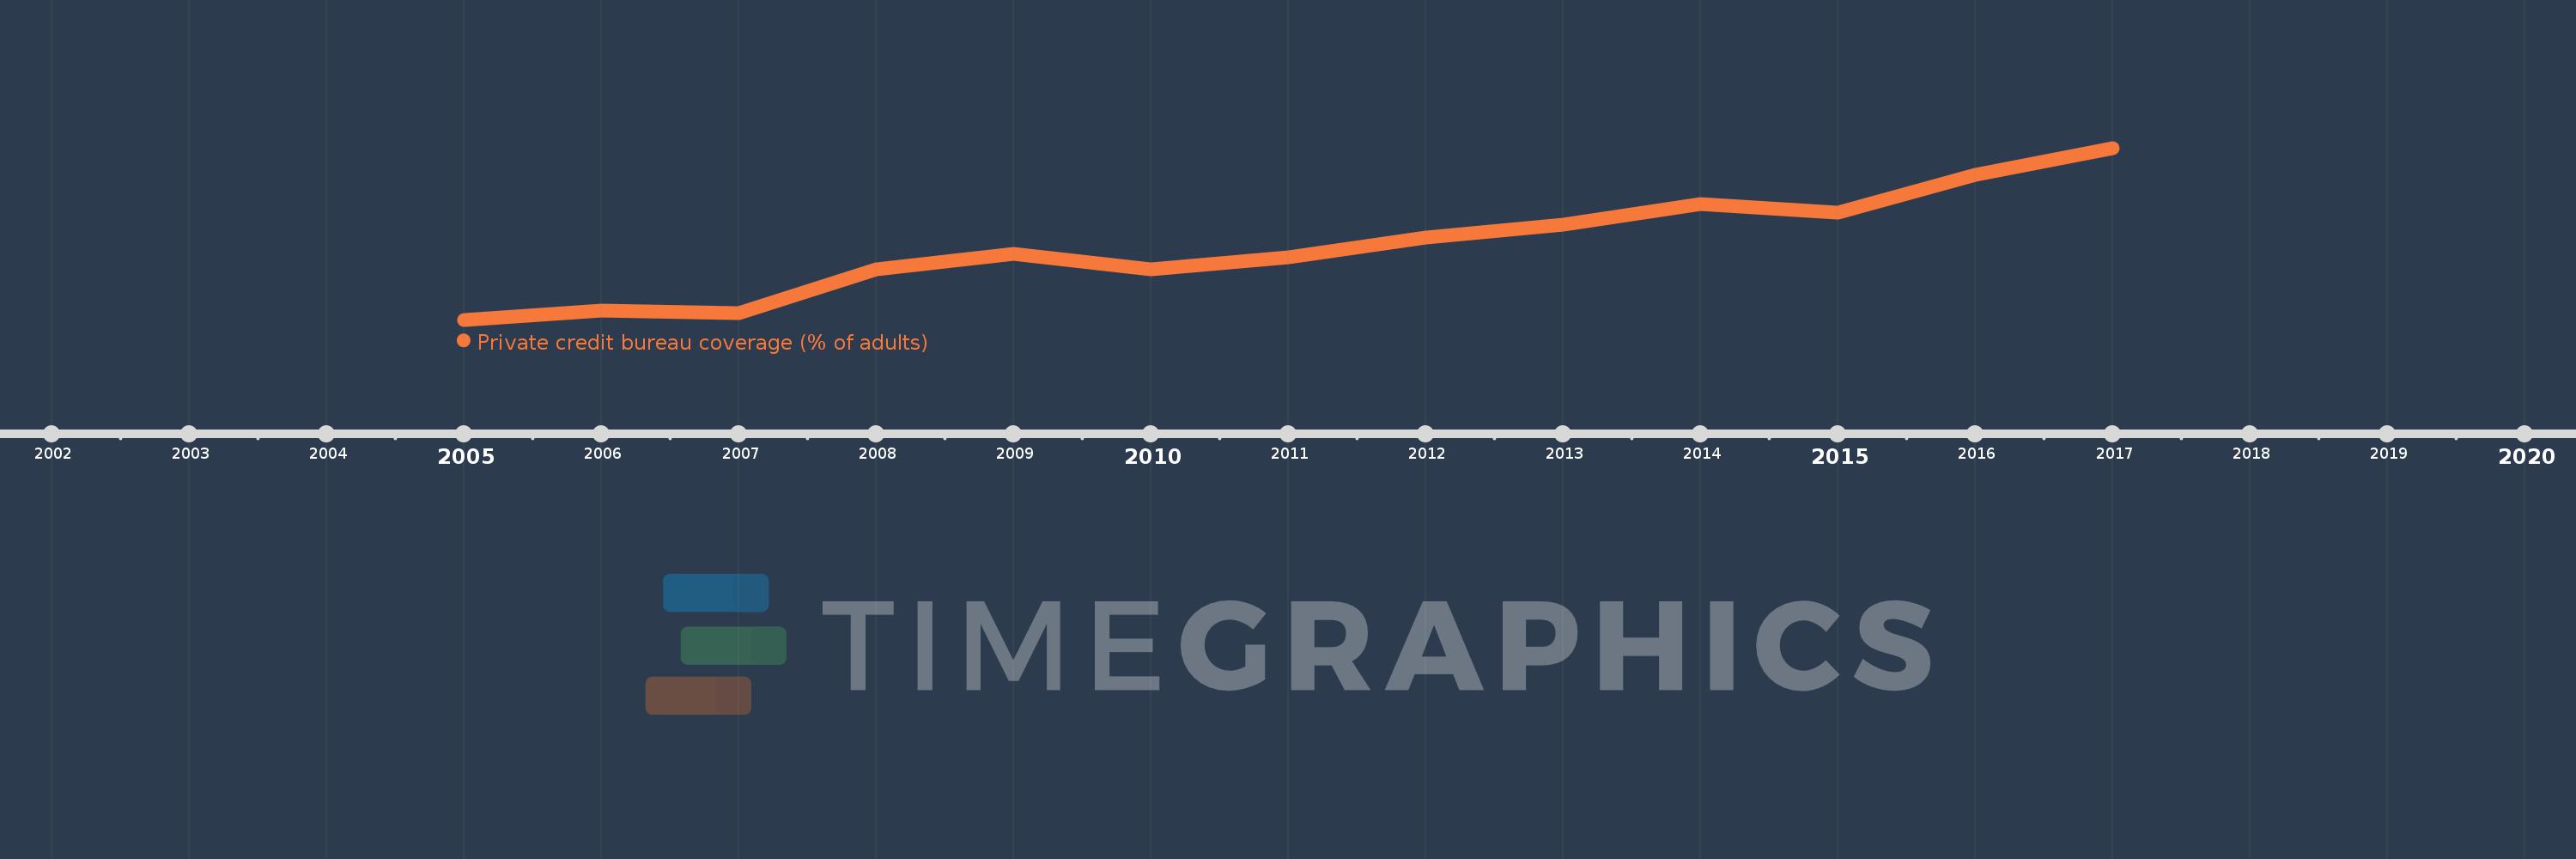
This timeline shows a graph from 2005 to 2017 of Sub-Saharan Africa (excluding high income). No data until 2004. Number of actual observations by date: 13.
Source name:
World Development Indicators
Source organization:
World Bank, Doing Business project (http://www.doingbusiness.org/).
Categories, topics:
Financial Sector, Private Sector
Last updated:
apr 23, 2017
Indicators value changes by year
Meaning:
5.811
Minimum:
4.349
jan 1, 2005
Maximum:
7.745
jan 1, 2017
At the date of observation
Value
Absolute change
Change from the previous value
jan 1, 2005
4.349
+4.349
0.0%
jan 1, 2006
4.534
+0.185
4.26%
jan 1, 2007
4.478
-0.056
-1.24%
jan 1, 2008
5.342
+0.864
19.31%
jan 1, 2009
5.644
+0.302
5.66%
jan 1, 2010
5.34
-0.304
-5.39%
jan 1, 2011
5.584
+0.244
4.58%
jan 1, 2012
5.971
+0.387
6.92%
jan 1, 2013
6.228
+0.257
4.31%
jan 1, 2014
6.635
+0.407
6.53%
jan 1, 2015
6.474
-0.161
-2.42%
jan 1, 2016
7.222
+0.748
11.55%
jan 1, 2017
7.745
+0.523
7.24%
Ranking of countries by current statistics by years