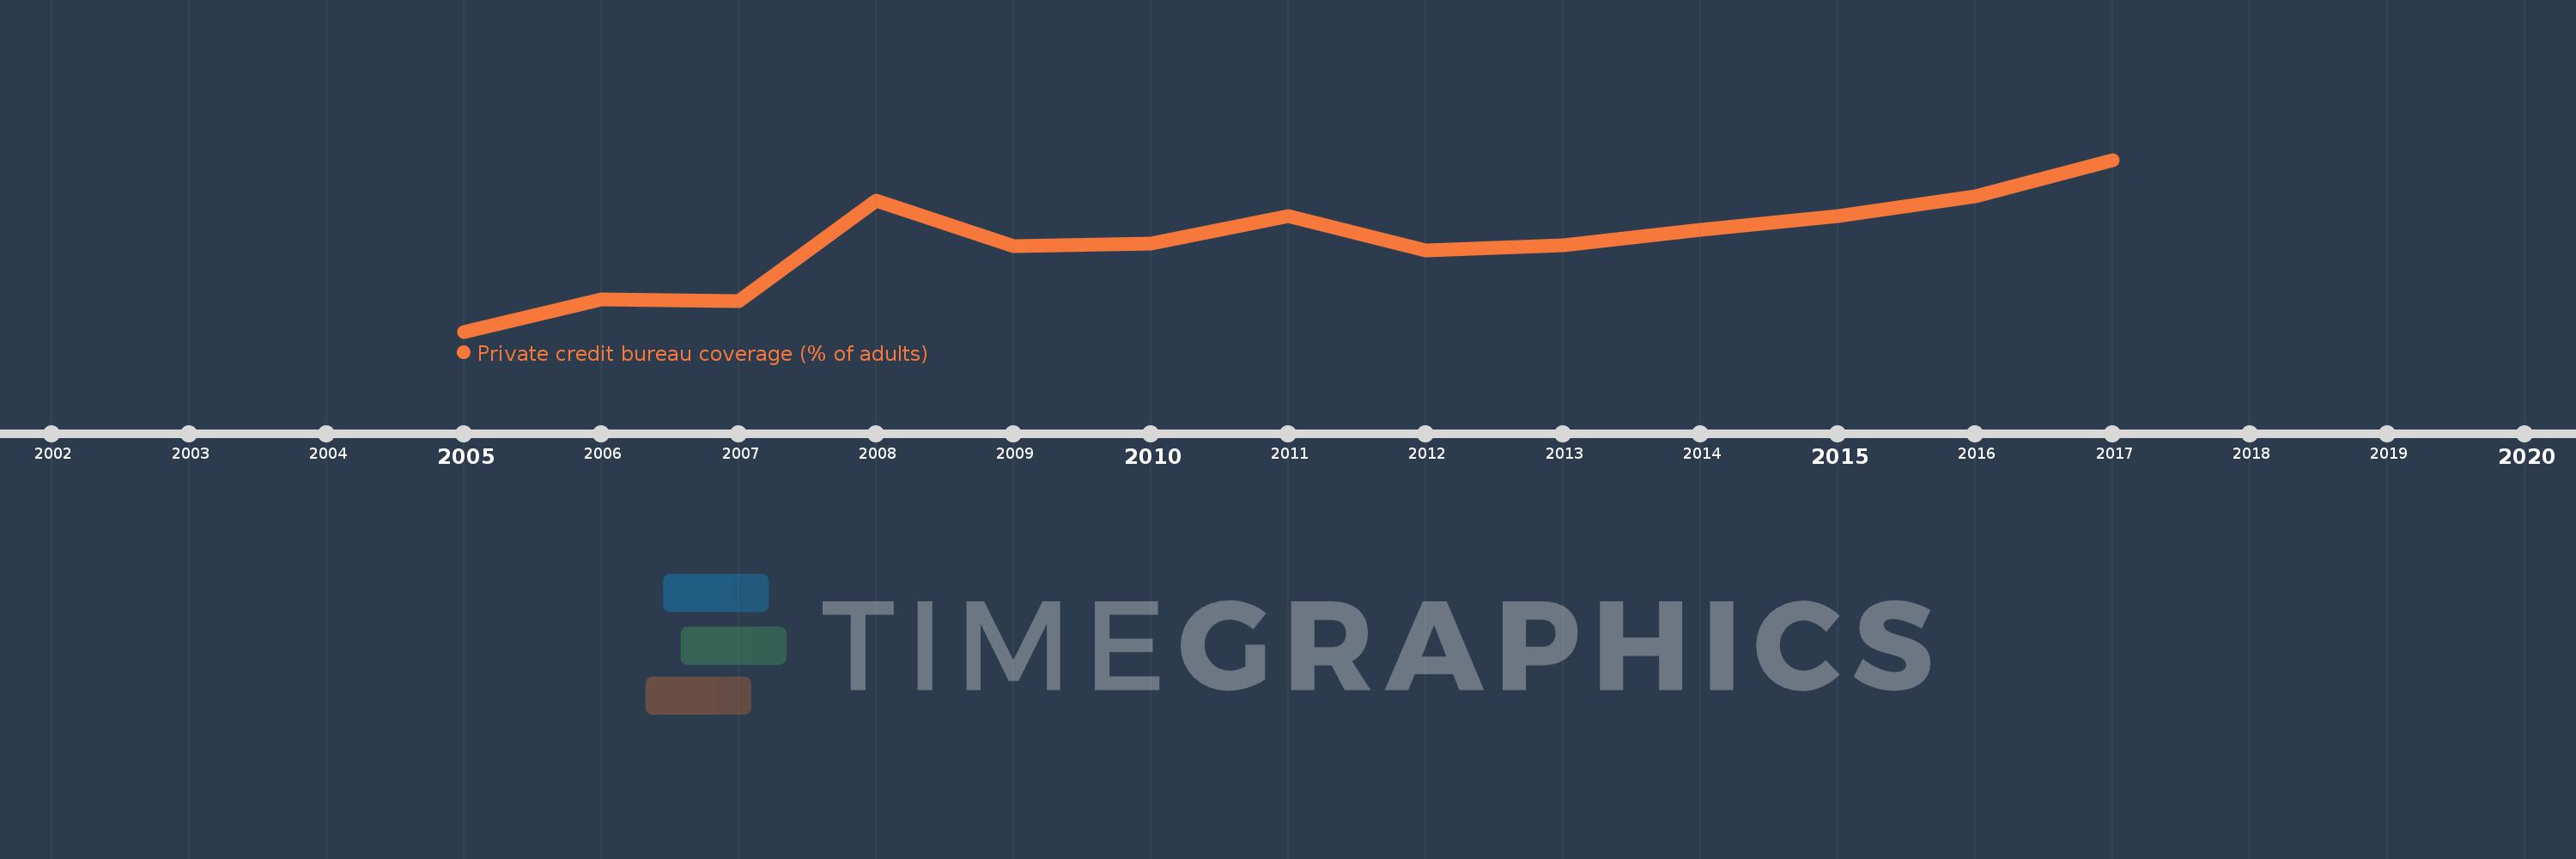
This timeline shows a graph from 2005 to 2017 of Heavily indebted poor countries (HIPC). No data until 2004. Number of actual observations by date: 13.
Source name:
World Development Indicators
Source organization:
World Bank, Doing Business project (http://www.doingbusiness.org/).
Categories, topics:
Financial Sector, Private Sector
Last updated:
apr 23, 2017
Indicators value changes by year
Meaning:
3.282
Minimum:
0.0
jan 1, 2005
Maximum:
6.244
jan 1, 2017
At the date of observation
Value
Absolute change
Change from the previous value
jan 1, 2005
0.0
0.0
0.0%
jan 1, 2006
1.17
+1.17
%
jan 1, 2007
1.116
-0.054
-4.66%
jan 1, 2008
4.753
+3.637
325.94%
jan 1, 2009
3.111
-1.642
-34.55%
jan 1, 2010
3.195
+0.084
2.71%
jan 1, 2011
4.184
+0.989
30.97%
jan 1, 2012
2.942
-1.242
-29.69%
jan 1, 2013
3.132
+0.189
6.44%
jan 1, 2014
3.713
+0.582
18.57%
jan 1, 2015
4.203
+0.489
13.18%
jan 1, 2016
4.903
+0.7
16.66%
jan 1, 2017
6.244
+1.341
27.35%
Ranking of countries by current statistics by years