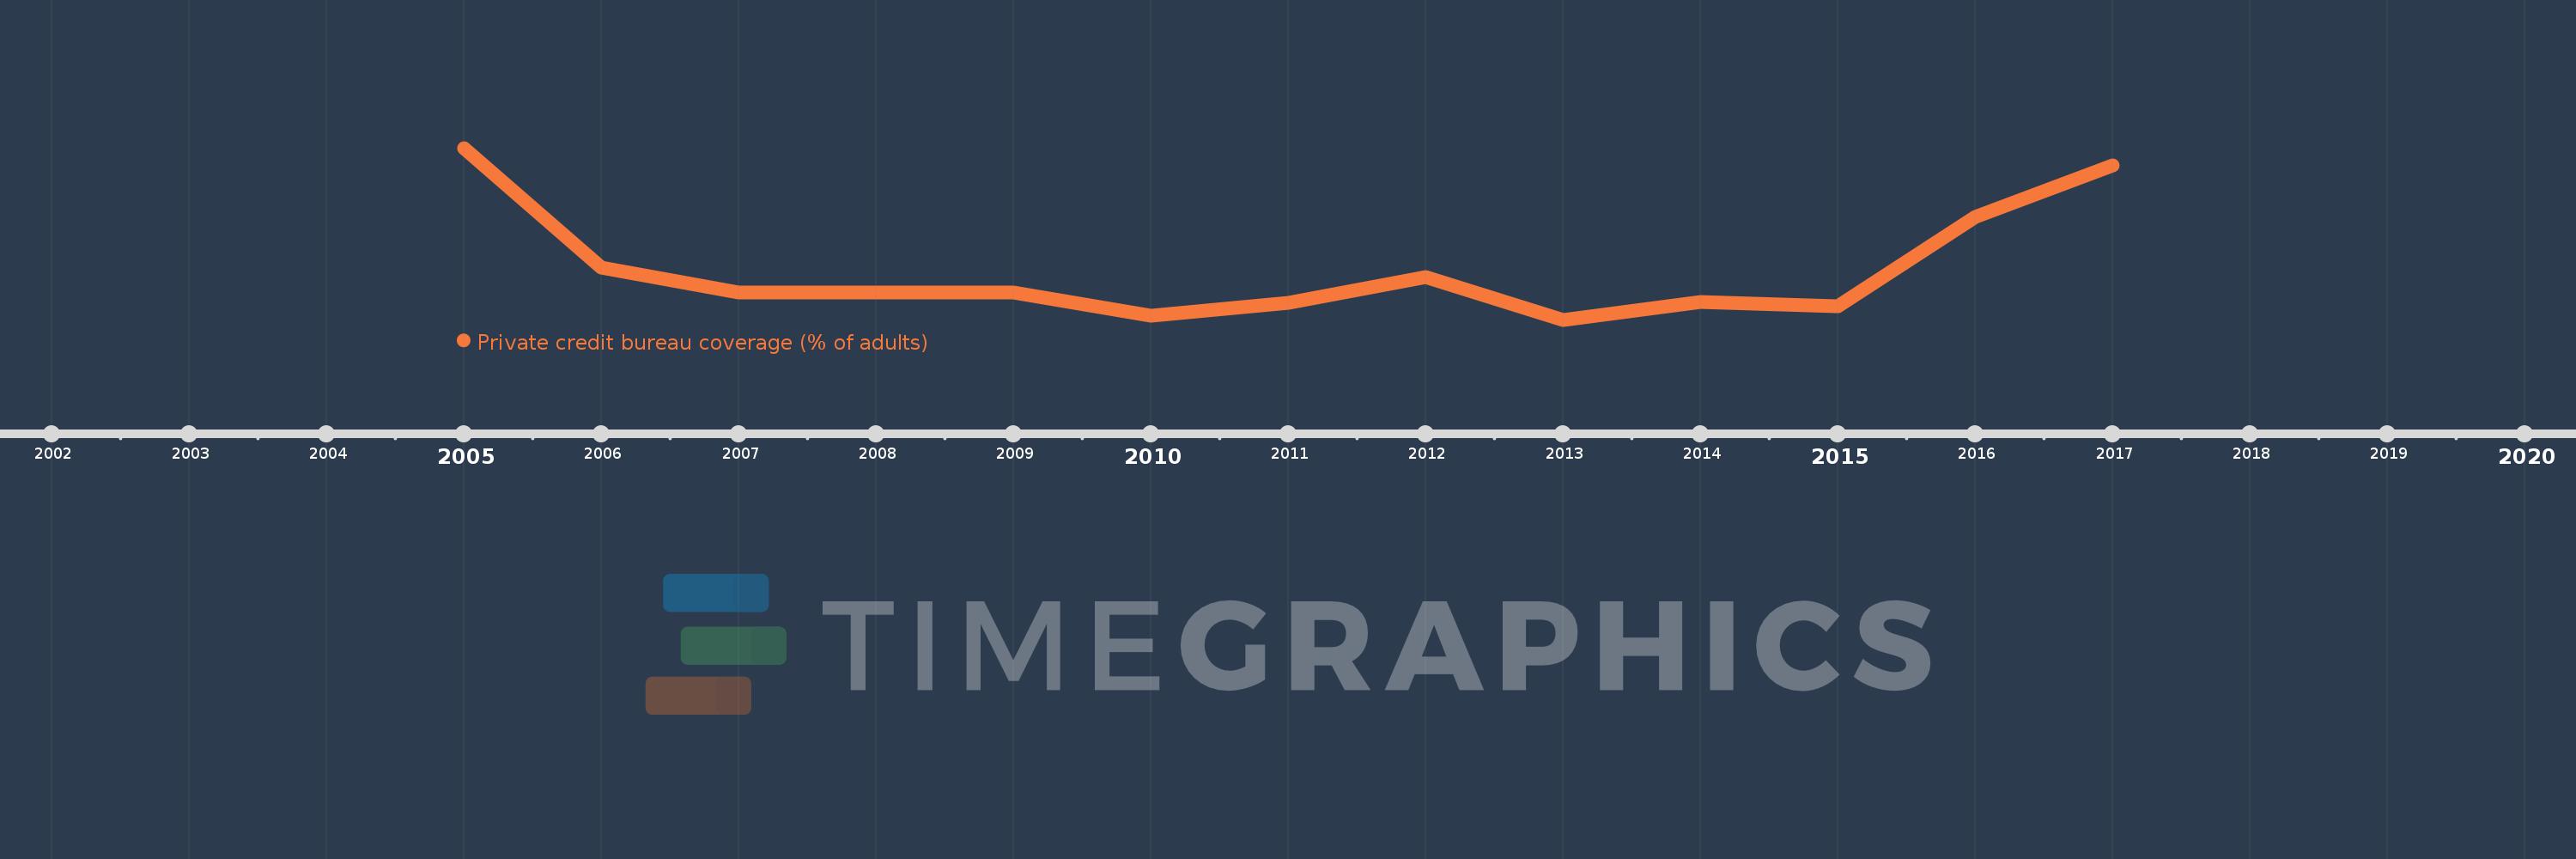
This timeline shows a graph from 2005 to 2017 of Fragile and conflict affected situations. No data until 2004. Number of actual observations by date: 13.
Source name:
World Development Indicators
Source organization:
World Bank, Doing Business project (http://www.doingbusiness.org/).
Categories, topics:
Financial Sector, Private Sector
Last updated:
apr 23, 2017
Indicators value changes by year
Meaning:
1.105
Minimum:
1.027
jan 1, 2013
Maximum:
1.292
jan 1, 2005
At the date of observation
Value
Absolute change
Change from the previous value
jan 1, 2005
1.292
+1.292
0.0%
jan 1, 2006
1.107
-0.185
-14.29%
jan 1, 2007
1.069
-0.038
-3.45%
jan 1, 2008
1.069
0.0
0.0%
jan 1, 2009
1.069
0.0
0.0%
jan 1, 2010
1.033
-0.036
-3.33%
jan 1, 2011
1.053
+0.02
1.94%
jan 1, 2012
1.093
+0.04
3.8%
jan 1, 2013
1.027
-0.066
-6.04%
jan 1, 2014
1.055
+0.027
2.65%
jan 1, 2015
1.048
-0.006
-0.57%
jan 1, 2016
1.185
+0.136
13.01%
jan 1, 2017
1.265
+0.08
6.74%
Ranking of countries by current statistics by years