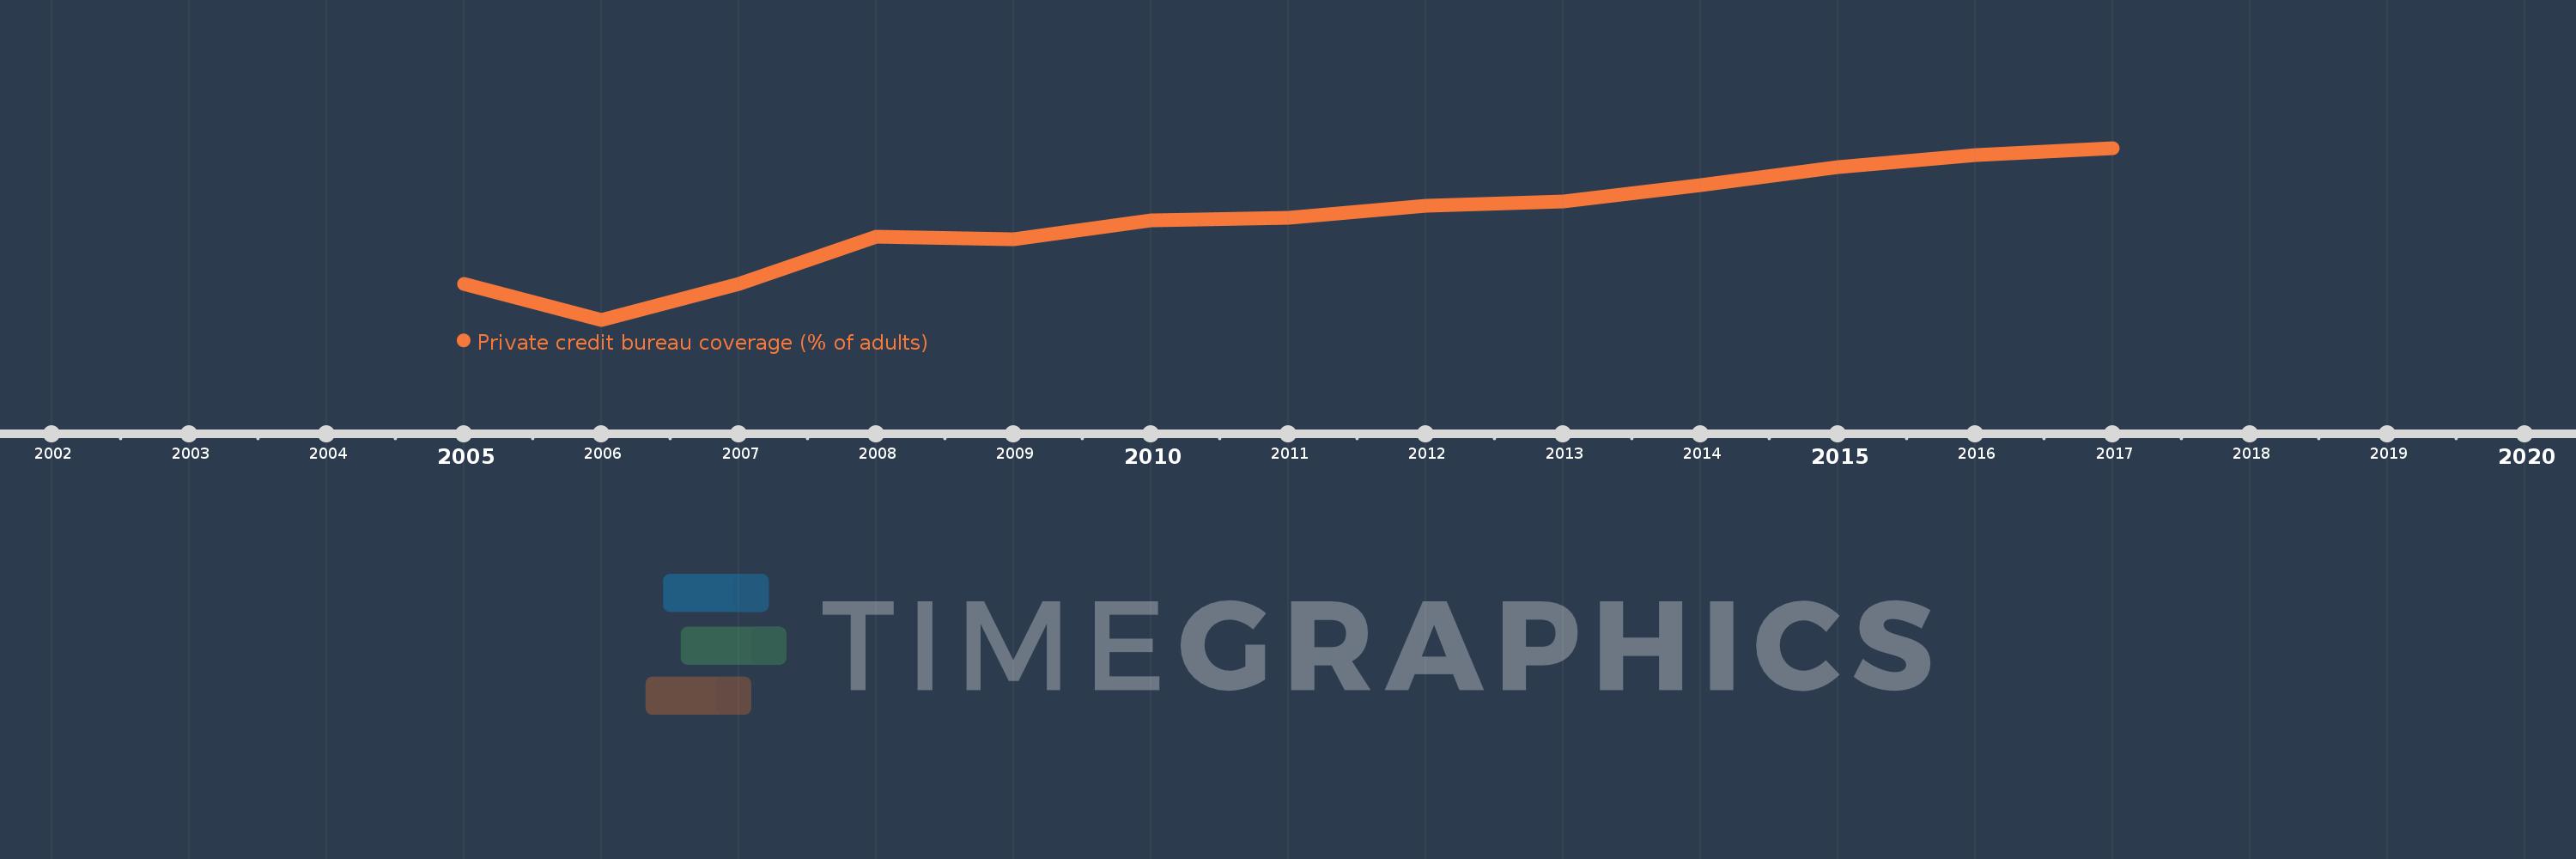
This timeline shows a graph from 2005 to 2017 of Latin America & the Caribbean (IDA & IBRD countries). No data until 2004. Number of actual observations by date: 13.
Source name:
World Development Indicators
Source organization:
World Bank, Doing Business project (http://www.doingbusiness.org/).
Categories, topics:
Financial Sector, Private Sector
Last updated:
apr 23, 2017
Indicators value changes by year
Meaning:
32.921
Minimum:
21.817
jan 1, 2006
Maximum:
41.013
jan 1, 2017
At the date of observation
Value
Absolute change
Change from the previous value
jan 1, 2005
25.833
+25.833
0.0%
jan 1, 2006
21.817
-4.017
-15.55%
jan 1, 2007
25.813
+3.997
18.32%
jan 1, 2008
31.1
+5.287
20.48%
jan 1, 2009
30.843
-0.257
-0.83%
jan 1, 2010
32.907
+2.063
6.69%
jan 1, 2011
33.18
+0.273
0.83%
jan 1, 2012
34.557
+1.377
4.15%
jan 1, 2013
35.0
+0.443
1.28%
jan 1, 2014
36.837
+1.837
5.25%
jan 1, 2015
38.89
+2.053
5.57%
jan 1, 2016
40.187
+1.297
3.33%
jan 1, 2017
41.013
+0.827
2.06%
Ranking of countries by current statistics by years