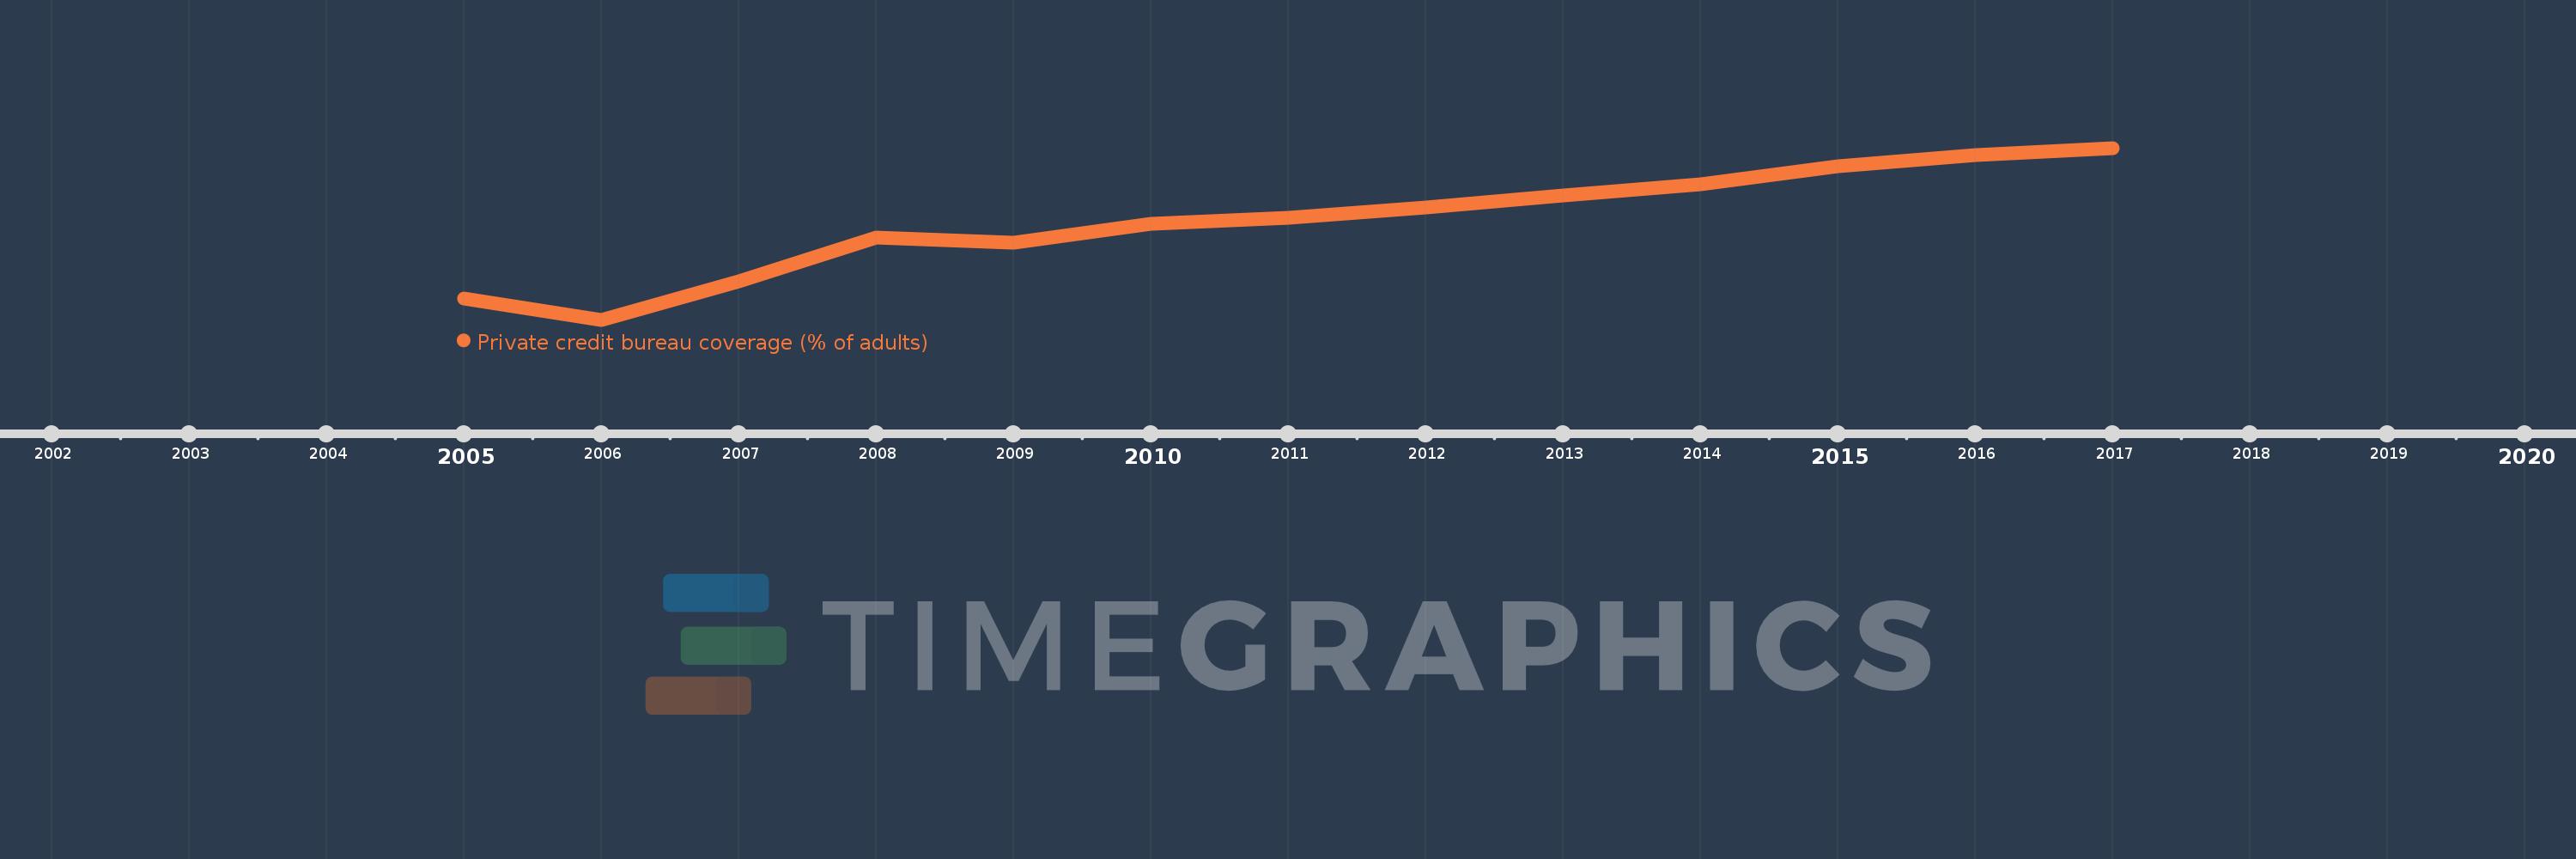
This timeline shows a graph from 2005 to 2017 of Latin America & Caribbean (excluding high income). No data until 2004. Number of actual observations by date: 13.
Source name:
World Development Indicators
Source organization:
World Bank, Doing Business project (http://www.doingbusiness.org/).
Categories, topics:
Financial Sector, Private Sector
Last updated:
apr 23, 2017
Indicators value changes by year
Meaning:
32.865
Minimum:
20.836
jan 1, 2006
Maximum:
41.828
jan 1, 2017
At the date of observation
Value
Absolute change
Change from the previous value
jan 1, 2005
23.416
+23.416
0.0%
jan 1, 2006
20.836
-2.58
-11.02%
jan 1, 2007
25.532
+4.696
22.54%
jan 1, 2008
30.852
+5.32
20.84%
jan 1, 2009
30.208
-0.644
-2.09%
jan 1, 2010
32.576
+2.368
7.84%
jan 1, 2011
33.332
+0.756
2.32%
jan 1, 2012
34.596
+1.264
3.79%
jan 1, 2013
36.02
+1.424
4.12%
jan 1, 2014
37.44
+1.42
3.94%
jan 1, 2015
39.62
+2.18
5.82%
jan 1, 2016
40.992
+1.372
3.46%
jan 1, 2017
41.828
+0.836
2.04%
Ranking of countries by current statistics by years