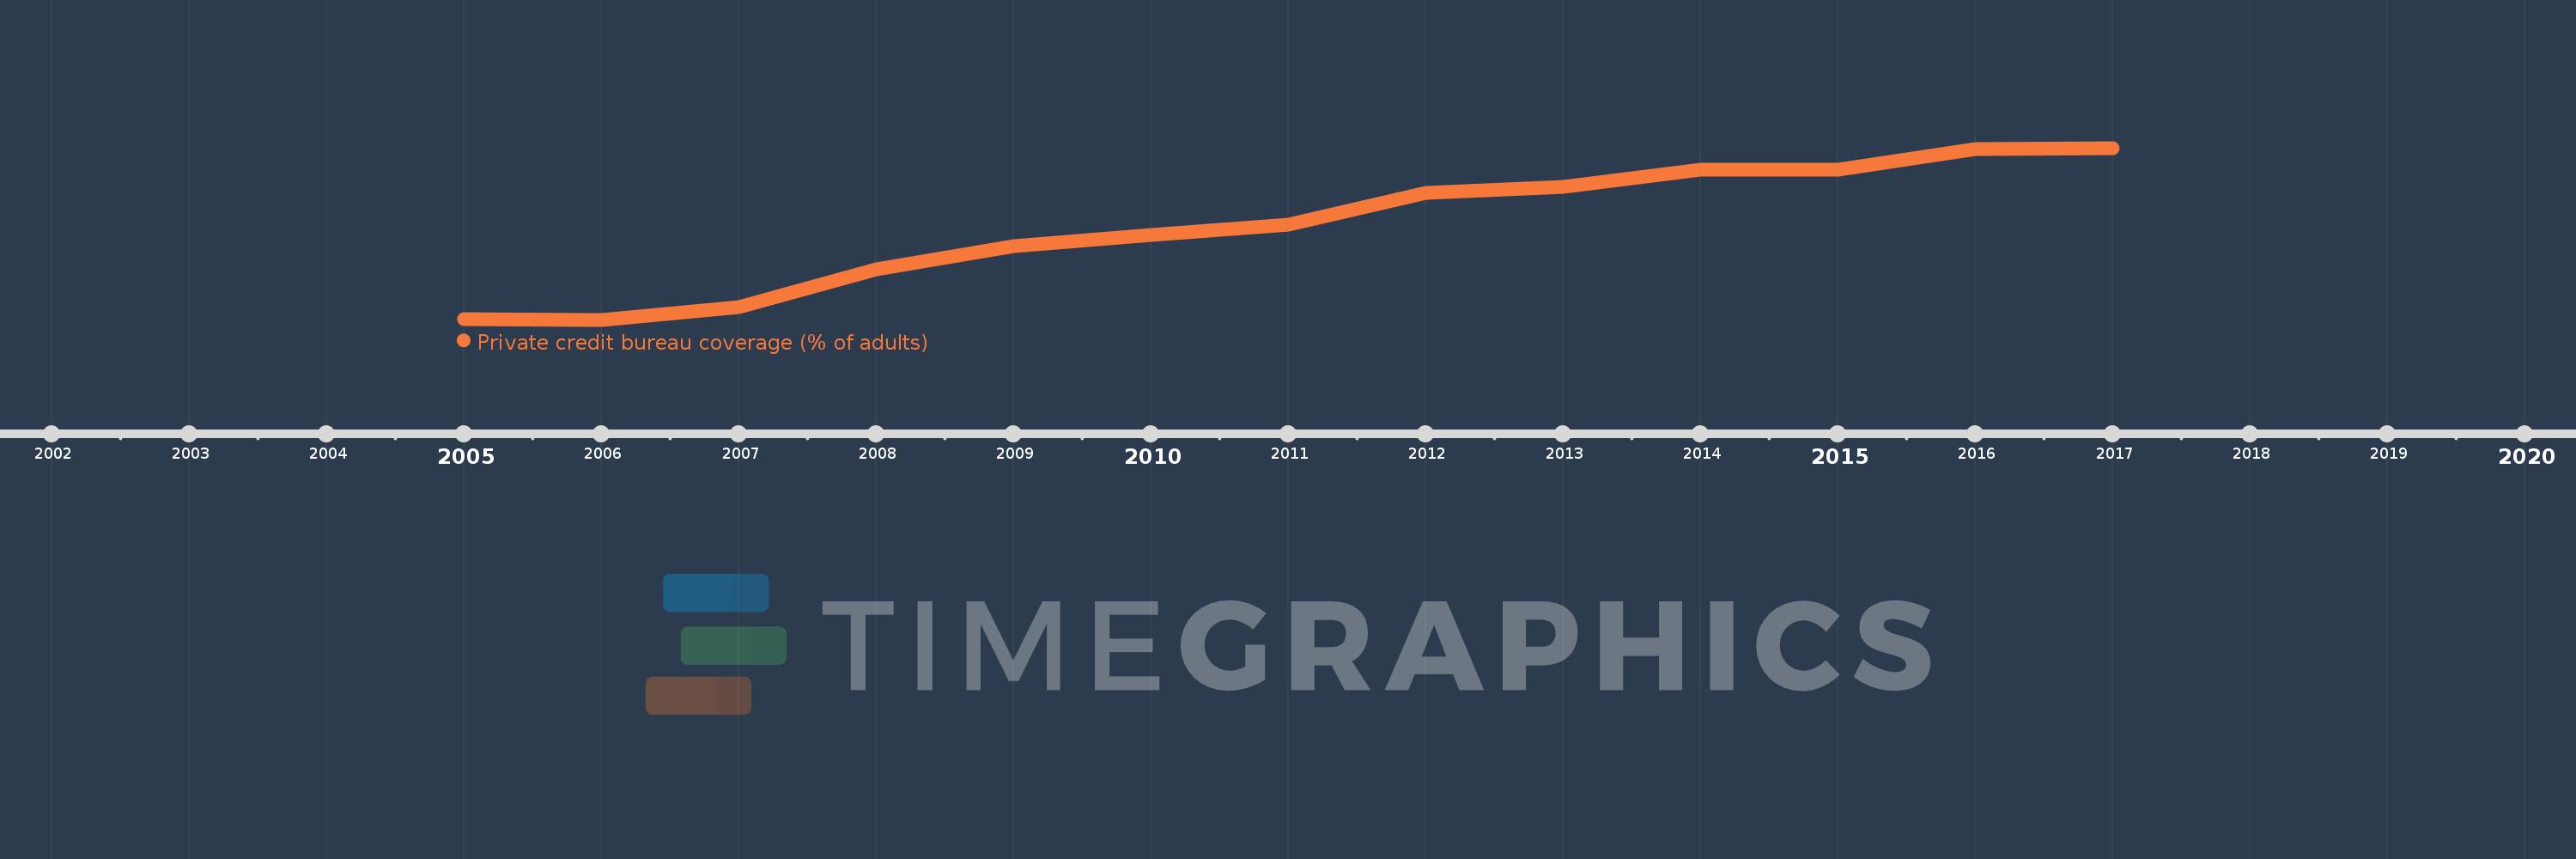
This timeline shows a graph from 2005 to 2017 of Europe & Central Asia (IDA & IBRD countries). No data until 2004. Number of actual observations by date: 13.
Source name:
World Development Indicators
Source organization:
World Bank, Doing Business project (http://www.doingbusiness.org/).
Categories, topics:
Financial Sector, Private Sector
Last updated:
apr 23, 2017
Indicators value changes by year
Meaning:
23.881
Minimum:
4.31
jan 1, 2006
Maximum:
40.136
jan 1, 2017
At the date of observation
Value
Absolute change
Change from the previous value
jan 1, 2005
4.4
+4.4
0.0%
jan 1, 2006
4.31
-0.09
-2.05%
jan 1, 2007
6.971
+2.661
61.75%
jan 1, 2008
14.914
+7.943
113.93%
jan 1, 2009
19.633
+4.719
31.64%
jan 1, 2010
22.027
+2.394
12.19%
jan 1, 2011
24.227
+2.2
9.99%
jan 1, 2012
30.777
+6.55
27.04%
jan 1, 2013
32.068
+1.291
4.19%
jan 1, 2014
35.527
+3.459
10.79%
jan 1, 2015
35.518
-0.009
-0.03%
jan 1, 2016
39.936
+4.418
12.44%
jan 1, 2017
40.136
+0.2
0.5%
Ranking of countries by current statistics by years