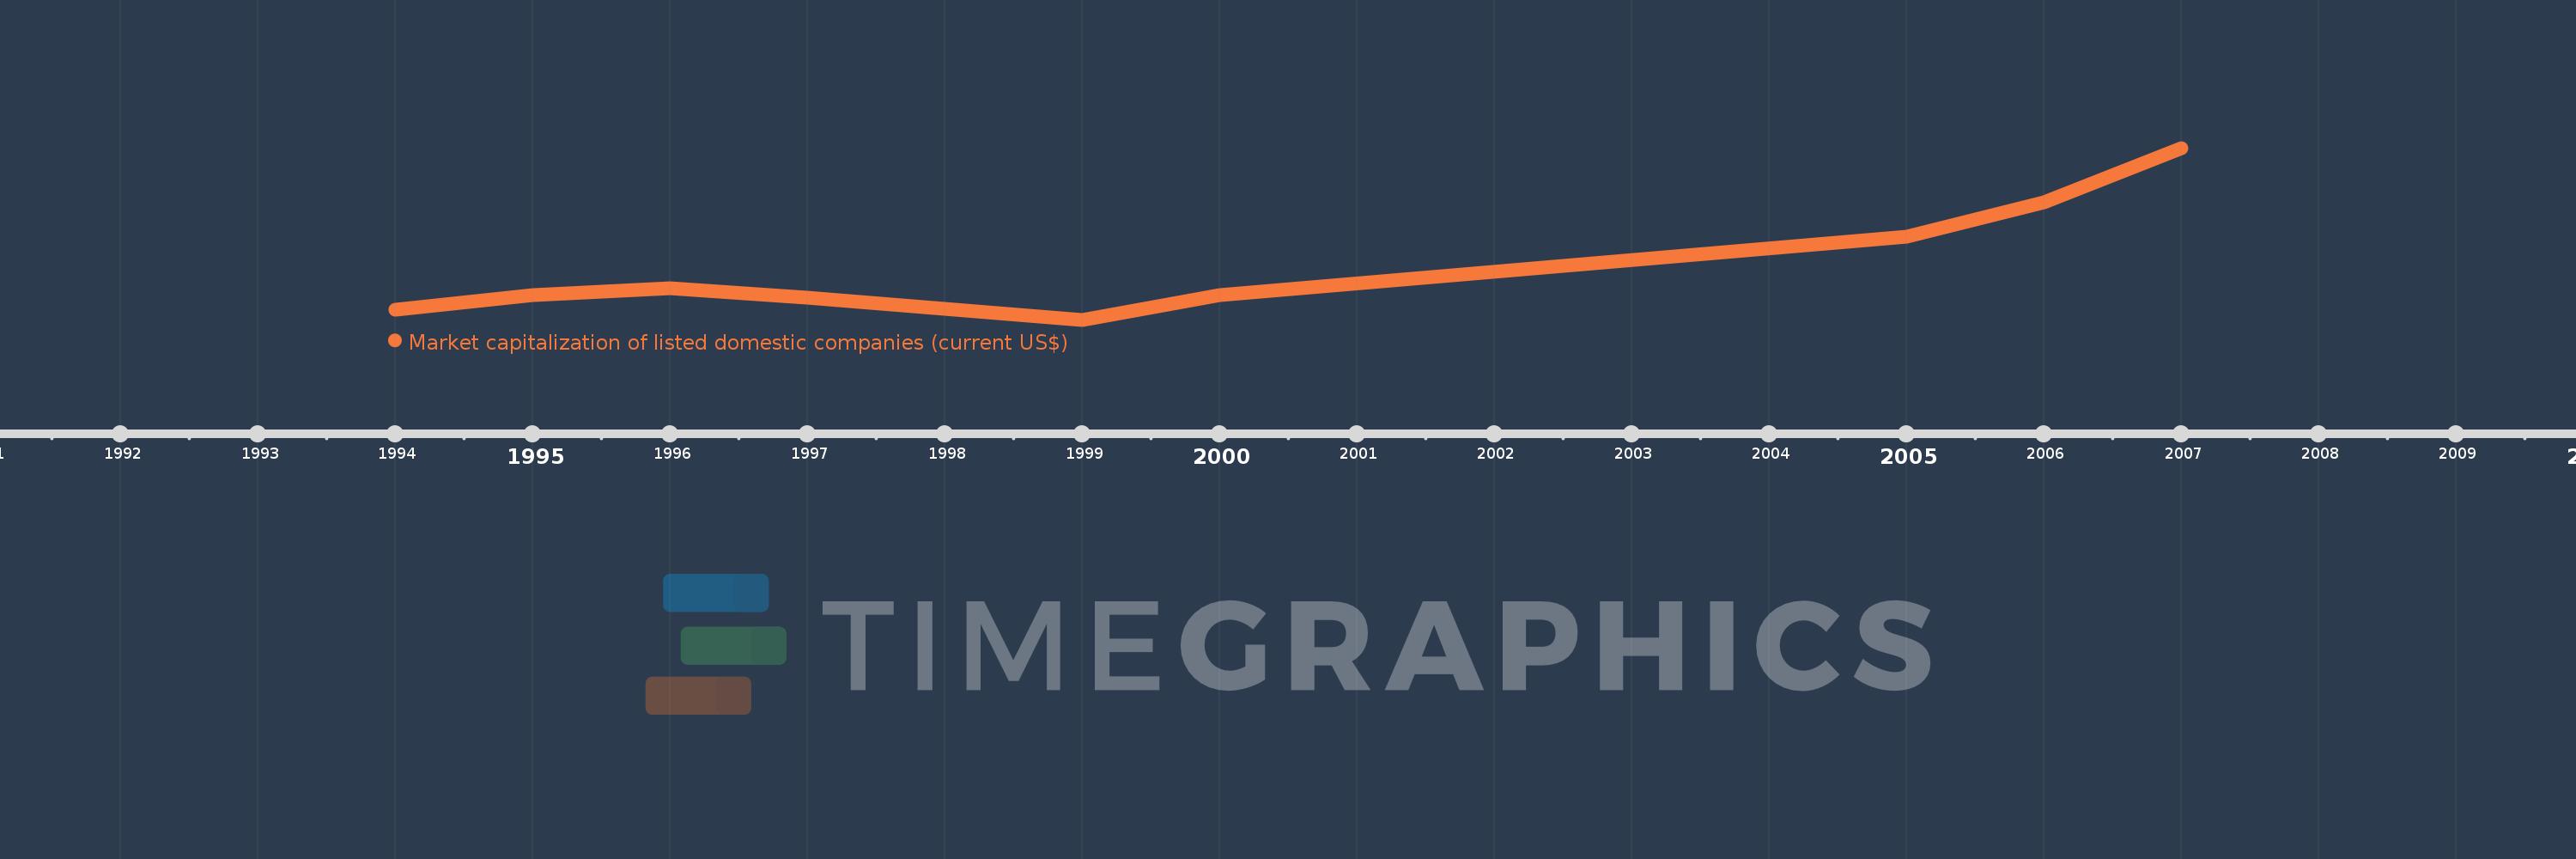
This timeline shows a graph from 1994 to 2007 of Sub-Saharan Africa (IDA & IBRD countries). No data until 1993. Number of actual observations by date: 9.
Source name:
World Development Indicators
Source organization:
World Federation of Exchanges database.
Categories, topics:
Financial Sector
Last updated:
apr 23, 2017
Indicators value changes by year
Meaning:
370.769 bln
Minimum:
188.339 bln
jan 1, 1999
Maximum:
769.326 bln
jan 1, 2007
At the date of observation
Value
Absolute change
Change from the previous value
jan 1, 1994
223.152 bln
+223.152 bln
0.0%
jan 1, 1995
271.273 bln
+48.121 bln
21.56%
jan 1, 1996
293.736 bln
+22.462 bln
8.28%
jan 1, 1997
264.414 bln
-29.322 bln
-9.98%
jan 1, 1999
188.339 bln
-76.075 bln
-28.77%
jan 1, 2000
271.134 bln
+82.795 bln
43.96%
jan 1, 2005
469.178 bln
+198.044 bln
73.04%
jan 1, 2006
586.375 bln
+117.197 bln
24.98%
jan 1, 2007
769.326 bln
+182.951 bln
31.2%
Ranking of countries by current statistics by years