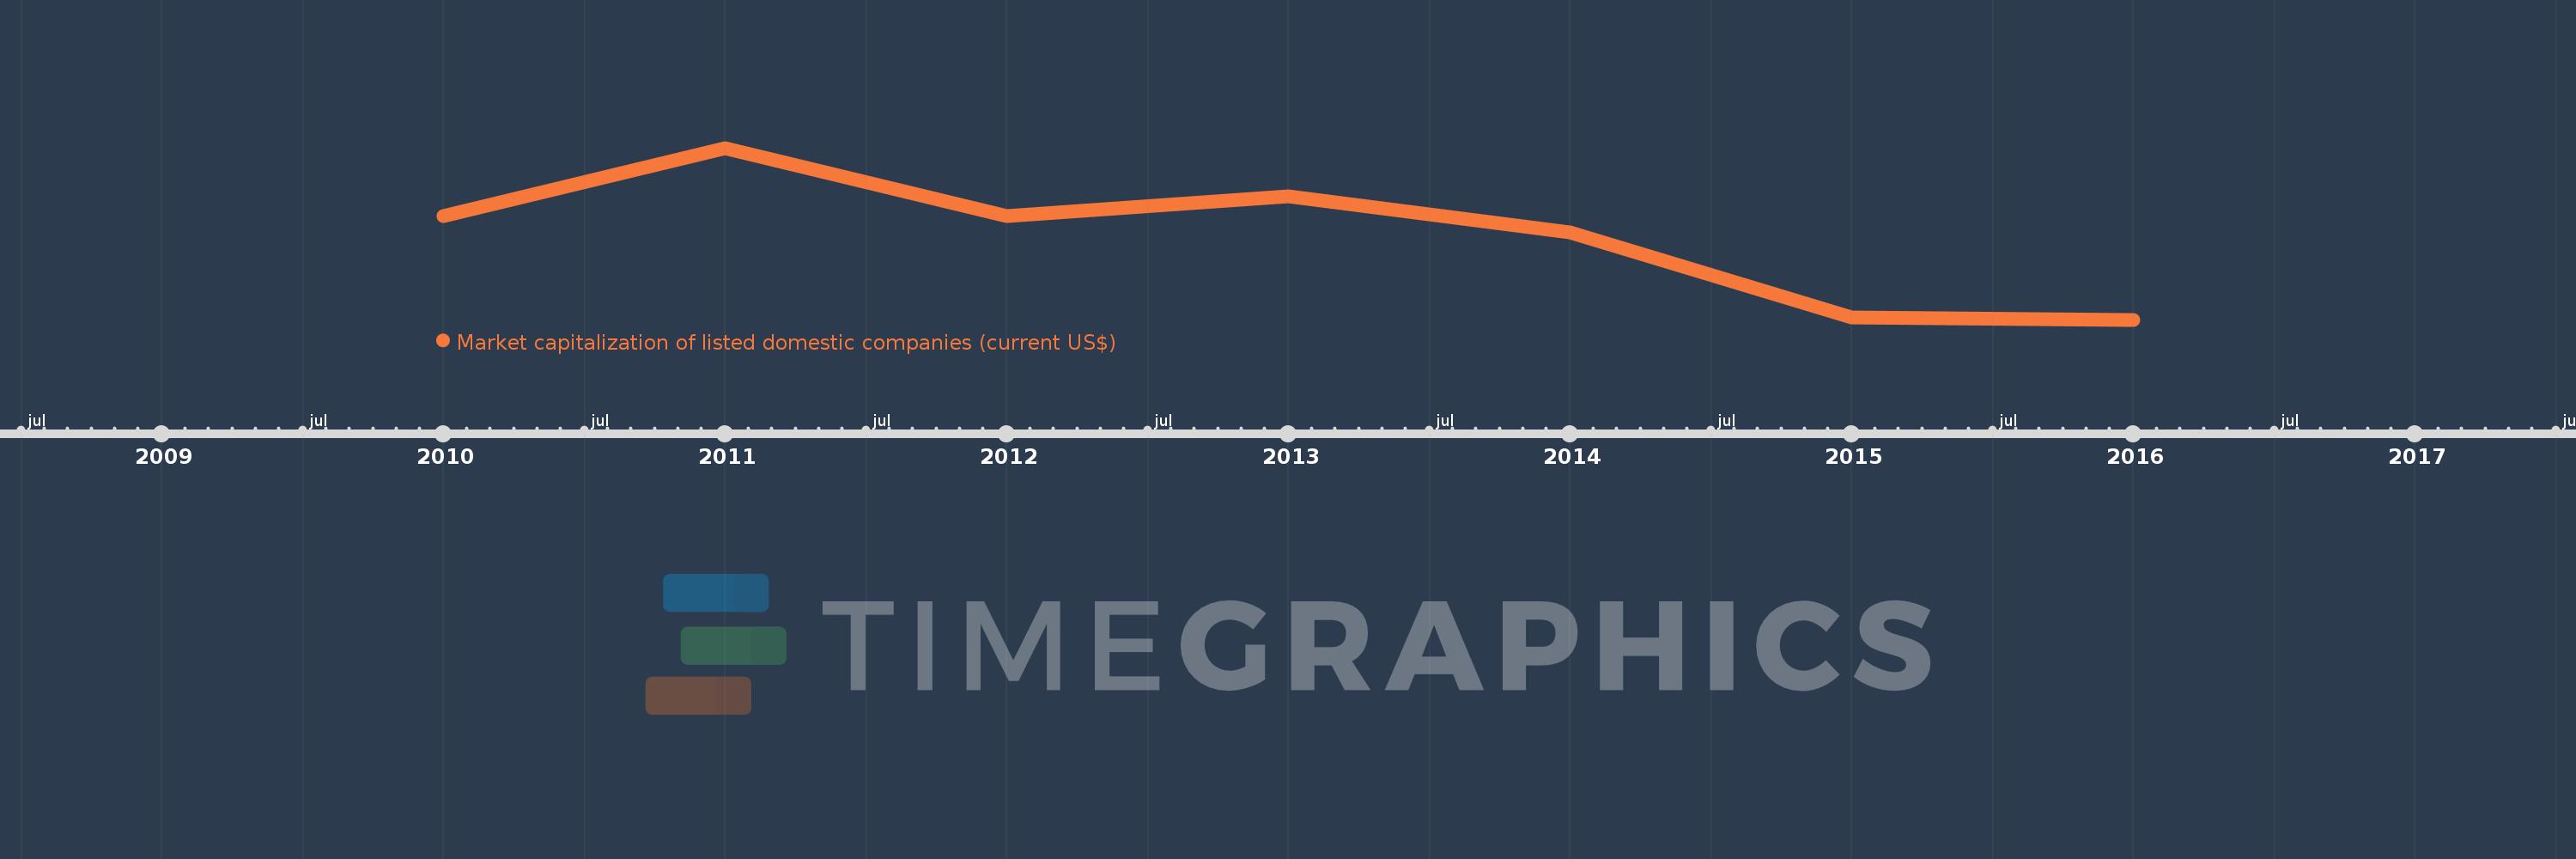
This timeline shows a graph from 2010 to 2016 of Europe & Central Asia (excluding high income). No data until 2009. Number of actual observations by date: 7.
Source name:
World Development Indicators
Source organization:
World Federation of Exchanges database.
Categories, topics:
Financial Sector
Last updated:
apr 23, 2017
Indicators value changes by year
Meaning:
980.277 bln
Minimum:
616.992 bln
jan 1, 2016
Maximum:
1.353 trl
jan 1, 2011
At the date of observation
Value
Absolute change
Change from the previous value
jan 1, 2010
1.062 trl
+1.062 trl
0.0%
jan 1, 2011
1.353 trl
+290.712 bln
27.37%
jan 1, 2012
1.063 trl
-290.211 bln
-21.45%
jan 1, 2013
1.146 trl
+83.518 bln
7.86%
jan 1, 2014
992.63 bln
-153.495 bln
-13.39%
jan 1, 2015
628.663 bln
-363.968 bln
-36.67%
jan 1, 2016
616.992 bln
-11.671 bln
-1.86%
Ranking of countries by current statistics by years