Download This statistics in other country:
Timeline:
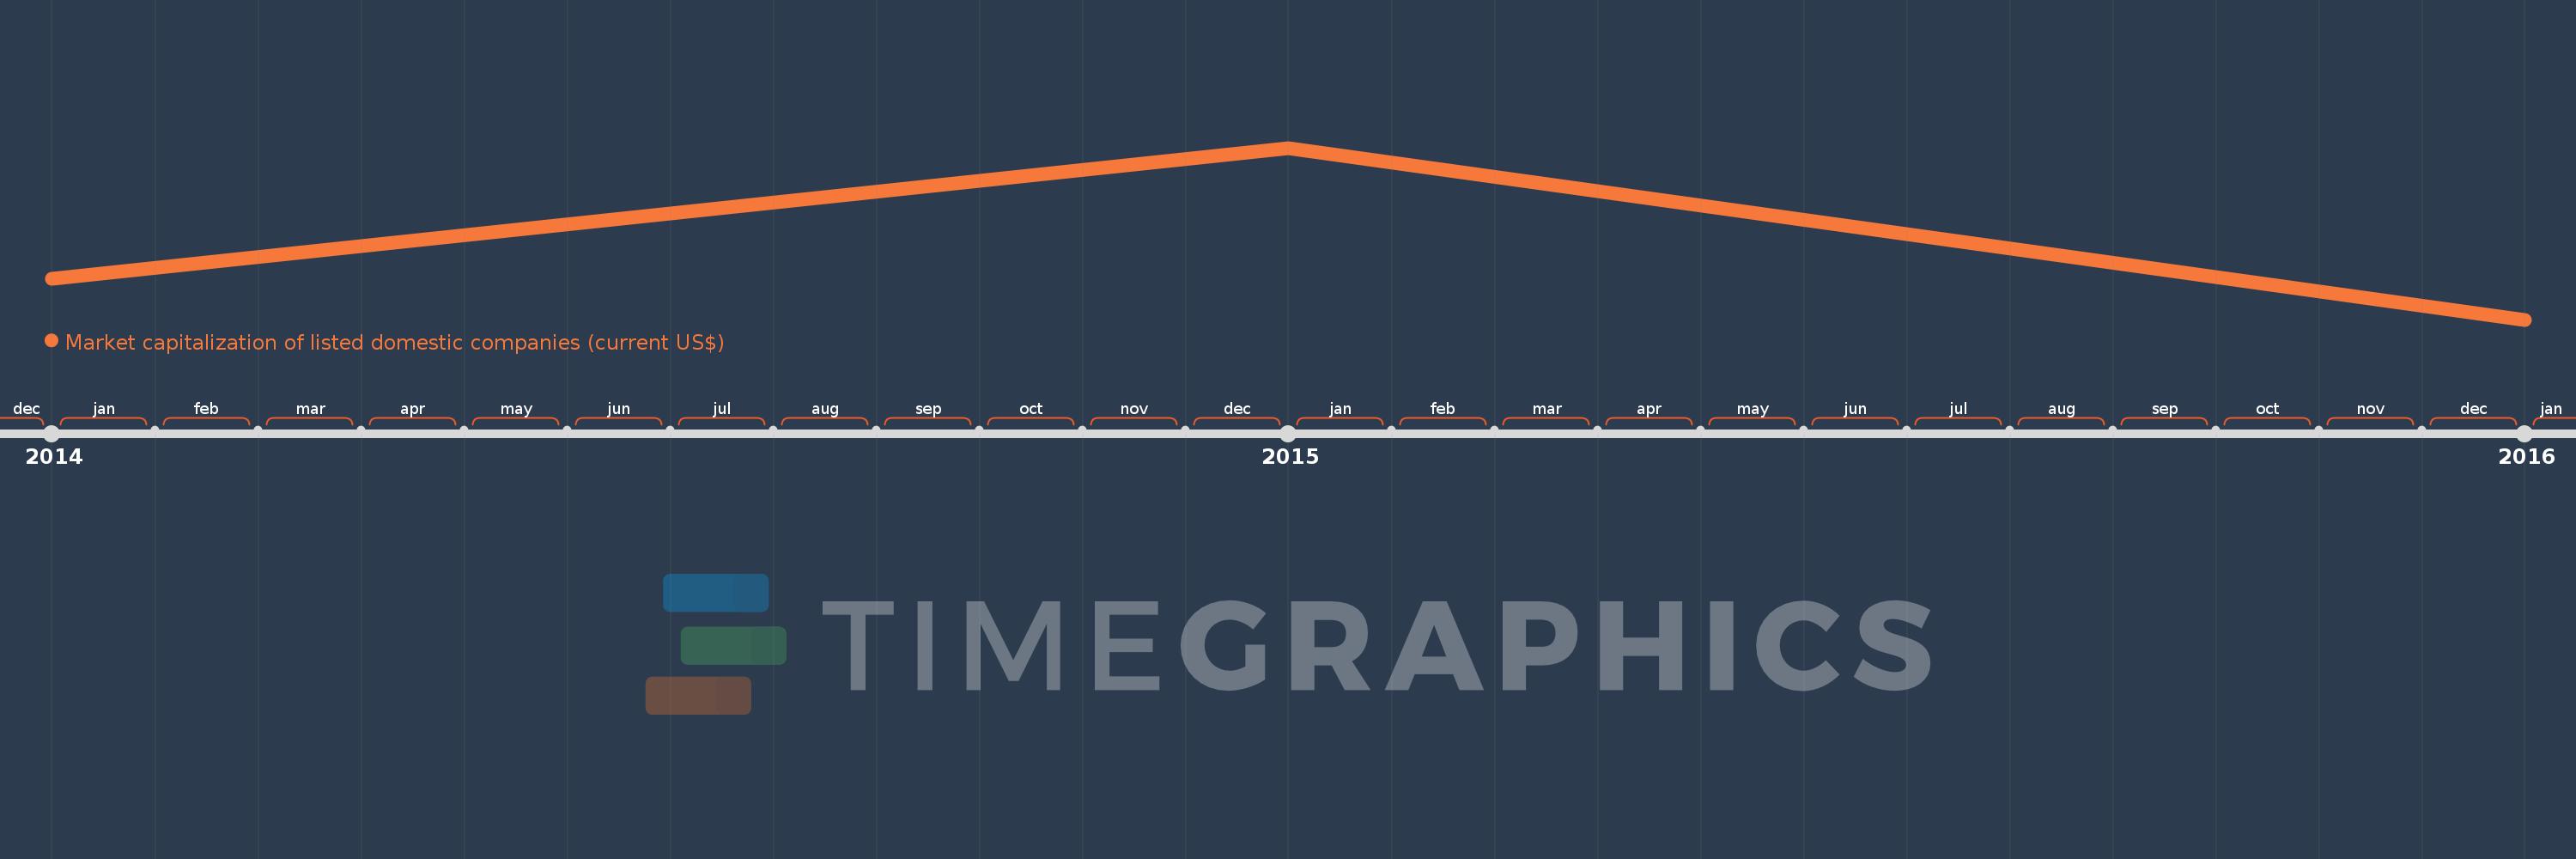
This timeline shows a graph from 2014 to 2016 of Arab World. No data until 2013. Number of actual observations by date: 3.
Source name:
World Development Indicators
Source organization:
World Federation of Exchanges database.
Categories, topics:
Financial Sector
Last updated:
apr 23, 2017
Indicators value changes by year
Minimum:
949.776 bln
jan 1, 2016
Maximum:
1.082 trl
jan 1, 2015
At the date of observation
Value
Absolute change
Change from the previous value
jan 1, 2014
981.506 bln
+981.506 bln
0.0%
jan 1, 2015
1.082 trl
+100.539 bln
10.24%
jan 1, 2016
949.776 bln
-132.269 bln
-12.22%
Ranking of countries by current statistics by years