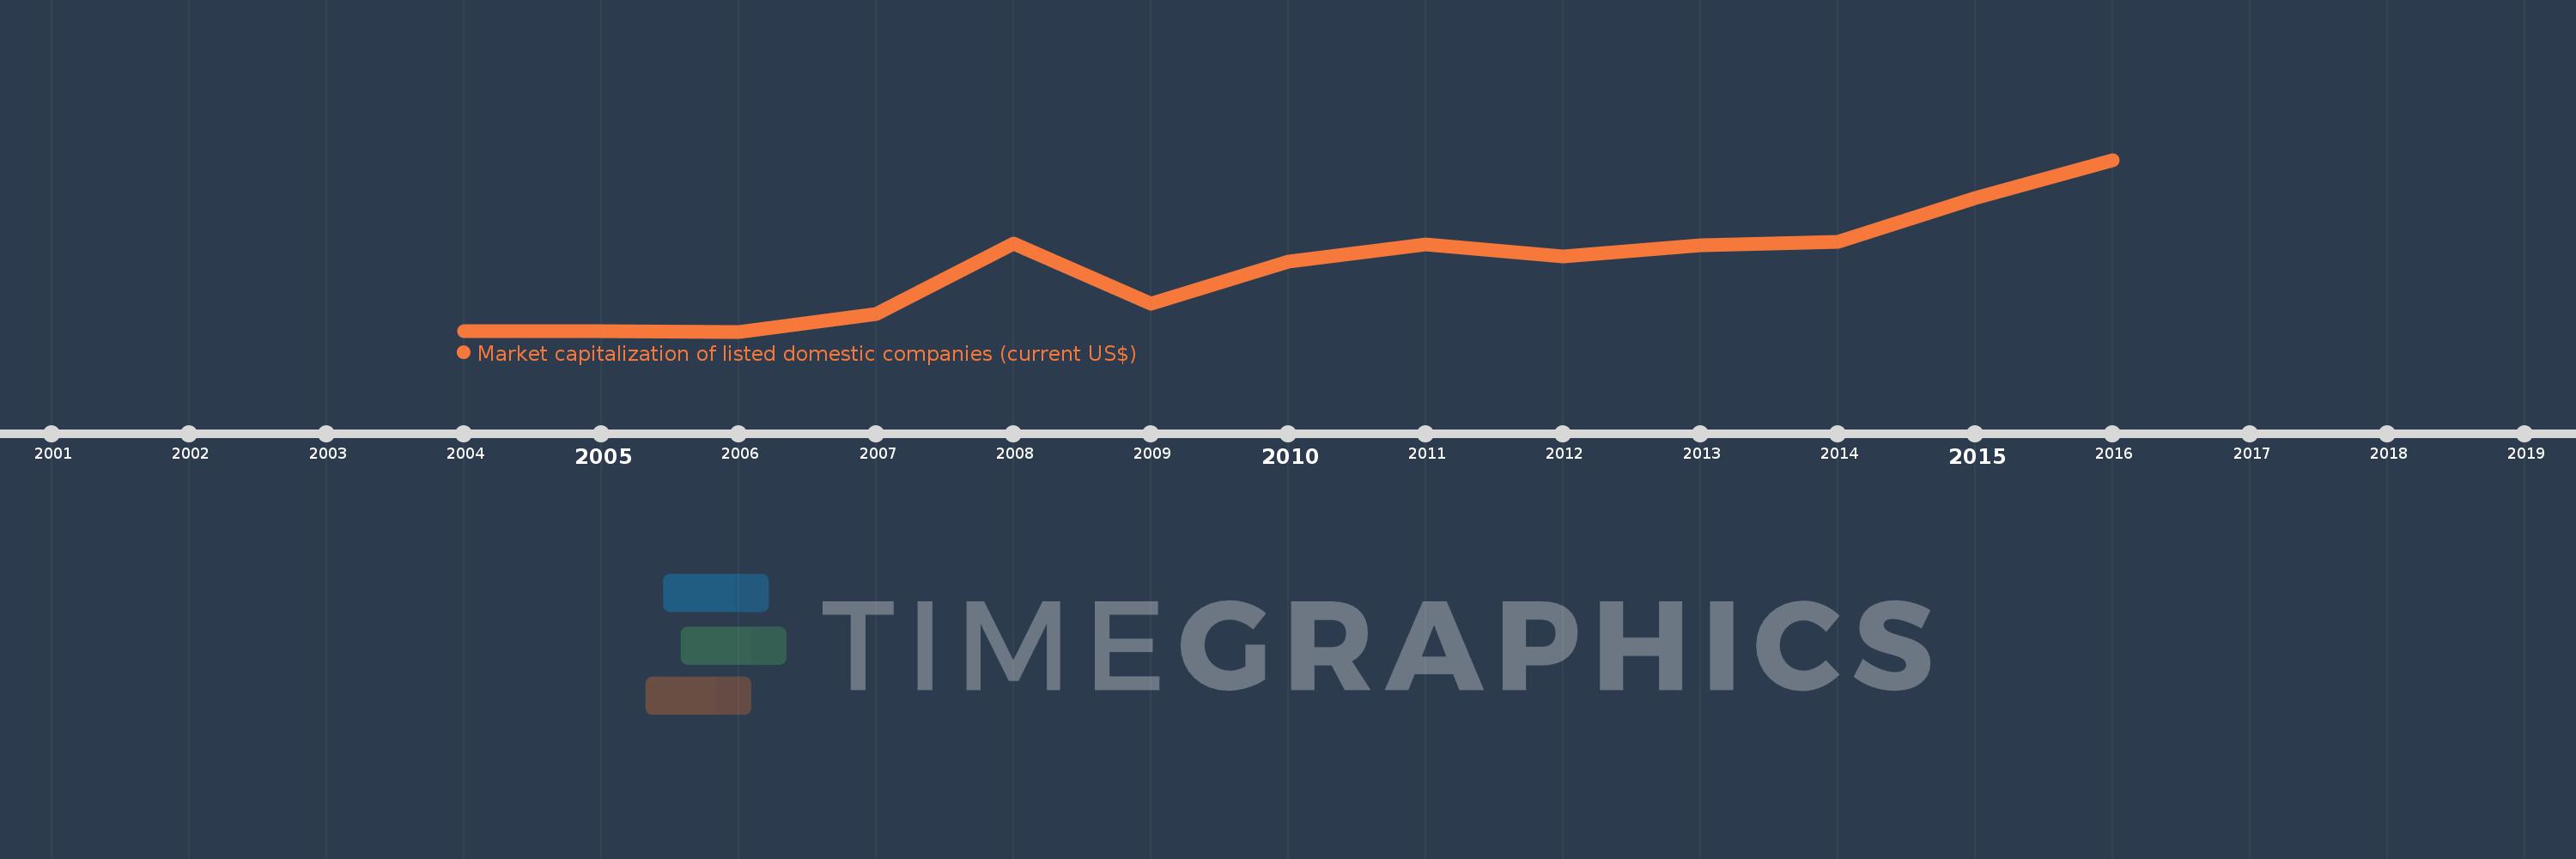
This timeline shows a graph from 2004 to 2016 of East Asia & Pacific (excluding high income). No data until 2003. Number of actual observations by date: 13.
Source name:
World Development Indicators
Source organization:
World Federation of Exchanges database.
Categories, topics:
Financial Sector
Last updated:
apr 23, 2017
Indicators value changes by year
Meaning:
4.154 trl
Minimum:
834.252 bln
jan 1, 2006
Maximum:
9.564 trl
jan 1, 2016
At the date of observation
Value
Absolute change
Change from the previous value
jan 1, 2004
874.083 bln
+874.083 bln
0.0%
jan 1, 2005
850.975 bln
-23.107 bln
-2.64%
jan 1, 2006
834.252 bln
-16.723 bln
-1.97%
jan 1, 2007
1.736 trl
+902.176 bln
108.14%
jan 1, 2008
5.33 trl
+3.593 trl
206.95%
jan 1, 2009
2.244 trl
-3.086 trl
-57.91%
jan 1, 2010
4.386 trl
+2.142 trl
95.47%
jan 1, 2011
5.275 trl
+889.067 bln
20.27%
jan 1, 2012
4.668 trl
-607.092 bln
-11.51%
jan 1, 2013
5.213 trl
+545.473 bln
11.69%
jan 1, 2014
5.408 trl
+194.949 bln
3.74%
jan 1, 2015
7.624 trl
+2.216 trl
40.99%
jan 1, 2016
9.564 trl
+1.939 trl
25.44%
Ranking of countries by current statistics by years