Download This statistics in other country:
Timeline:
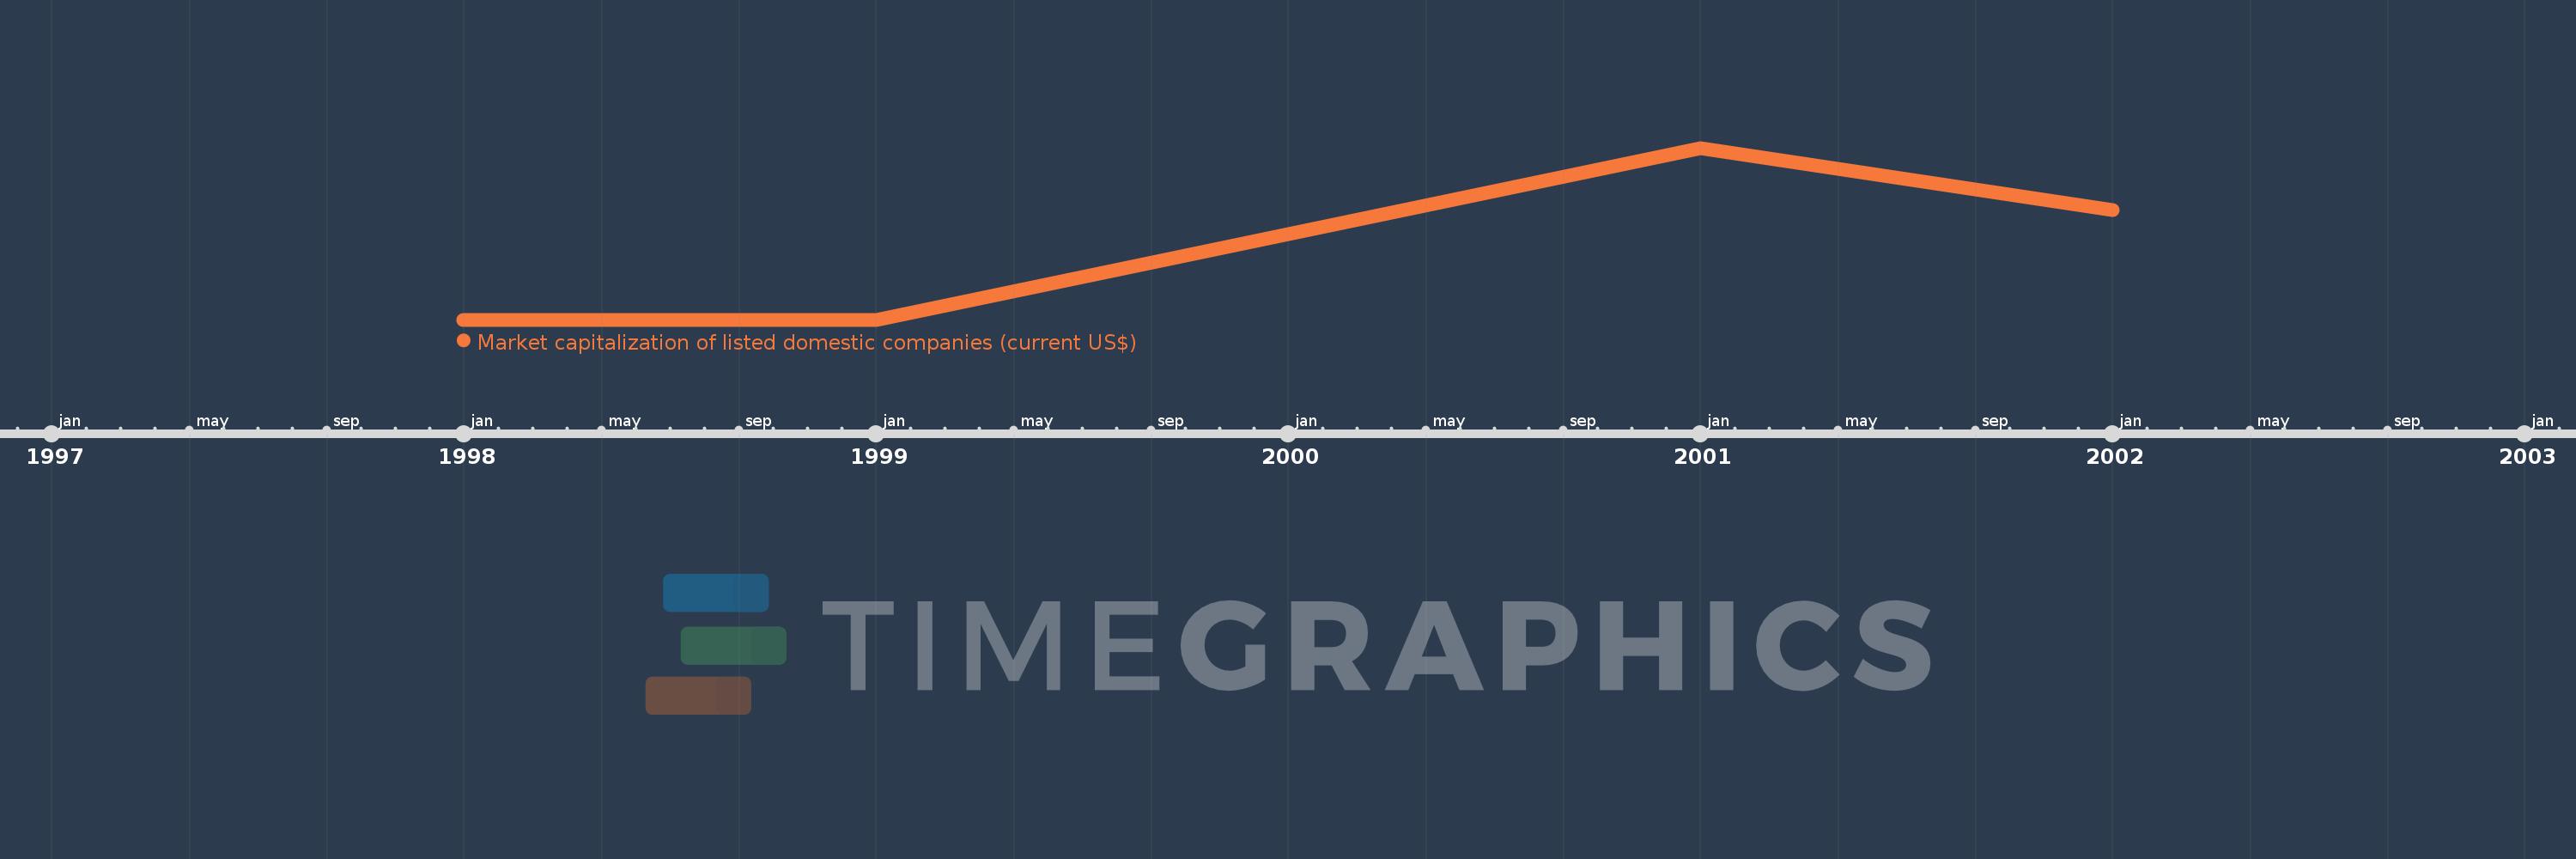
This timeline shows a graph from 1998 to 2002 of Honduras. No data until 1997. Number of actual observations by date: 4.
Source name:
World Development Indicators
Source organization:
World Federation of Exchanges database.
Categories, topics:
Financial Sector
Last updated:
apr 23, 2017
Indicators value changes by year
Minimum:
444.02 mln
jan 1, 1998
Maximum:
63.299 bln
jan 1, 2001
At the date of observation
Value
Absolute change
Change from the previous value
jan 1, 1998
444.02 mln
+444.02 mln
0.0%
jan 1, 1999
459.24 mln
+15.22 mln
3.43%
jan 1, 2001
63.299 bln
+62.84 bln
13.68K%
jan 1, 2002
40.719 bln
-22.58 bln
-35.67%
Ranking of countries by current statistics by years