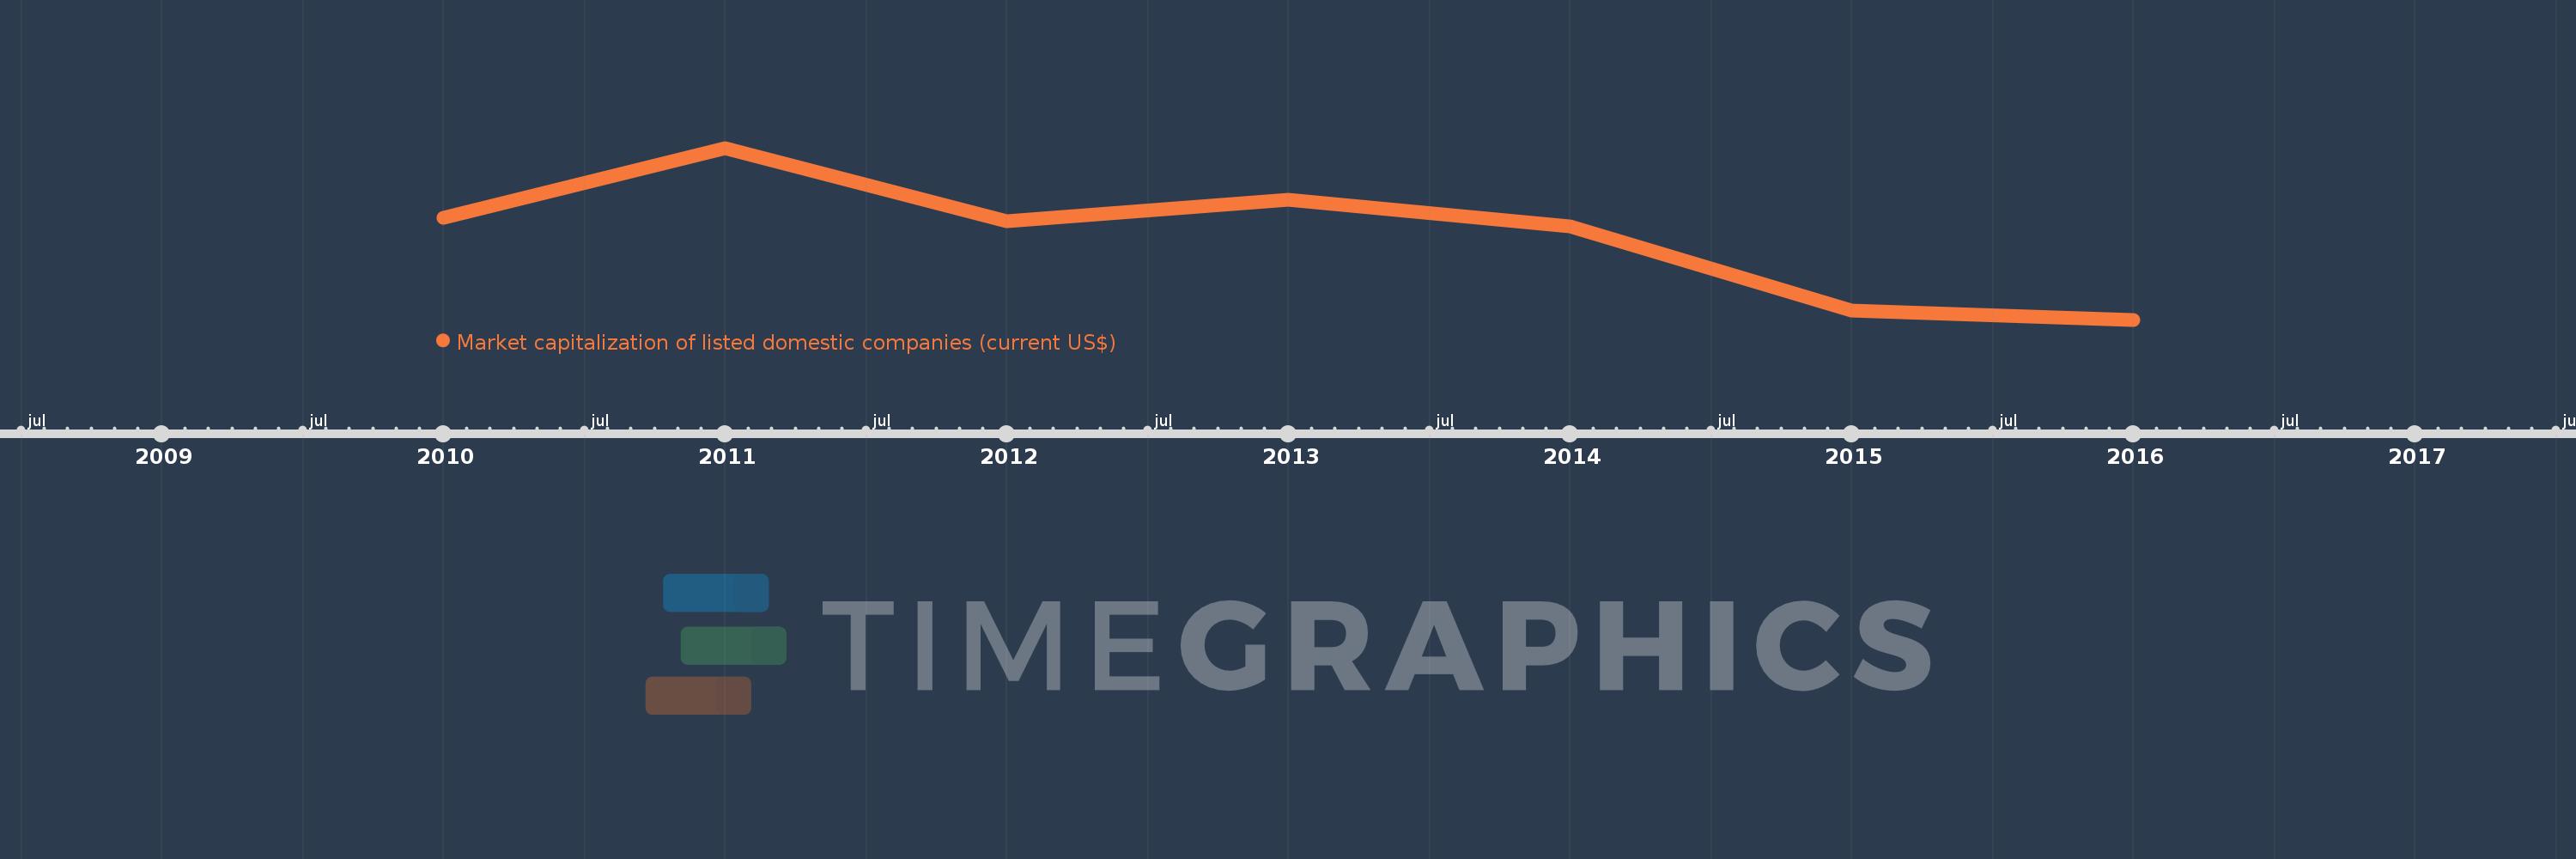
This timeline shows a graph from 2010 to 2016 of Europe & Central Asia (IDA & IBRD countries). No data until 2009. Number of actual observations by date: 7.
Source name:
World Development Indicators
Source organization:
World Federation of Exchanges database.
Categories, topics:
Financial Sector
Last updated:
apr 23, 2017
Indicators value changes by year
Meaning:
1.158 trl
Minimum:
754.761 bln
jan 1, 2016
Maximum:
1.569 trl
jan 1, 2011
At the date of observation
Value
Absolute change
Change from the previous value
jan 1, 2010
1.24 trl
+1.24 trl
0.0%
jan 1, 2011
1.569 trl
+329.434 bln
26.57%
jan 1, 2012
1.223 trl
-345.71 bln
-22.03%
jan 1, 2013
1.324 trl
+100.124 bln
8.18%
jan 1, 2014
1.197 trl
-126.36 bln
-9.55%
jan 1, 2015
797.558 bln
-399.615 bln
-33.38%
jan 1, 2016
754.761 bln
-42.797 bln
-5.37%
Ranking of countries by current statistics by years