Download This statistics in other country:
Timeline:
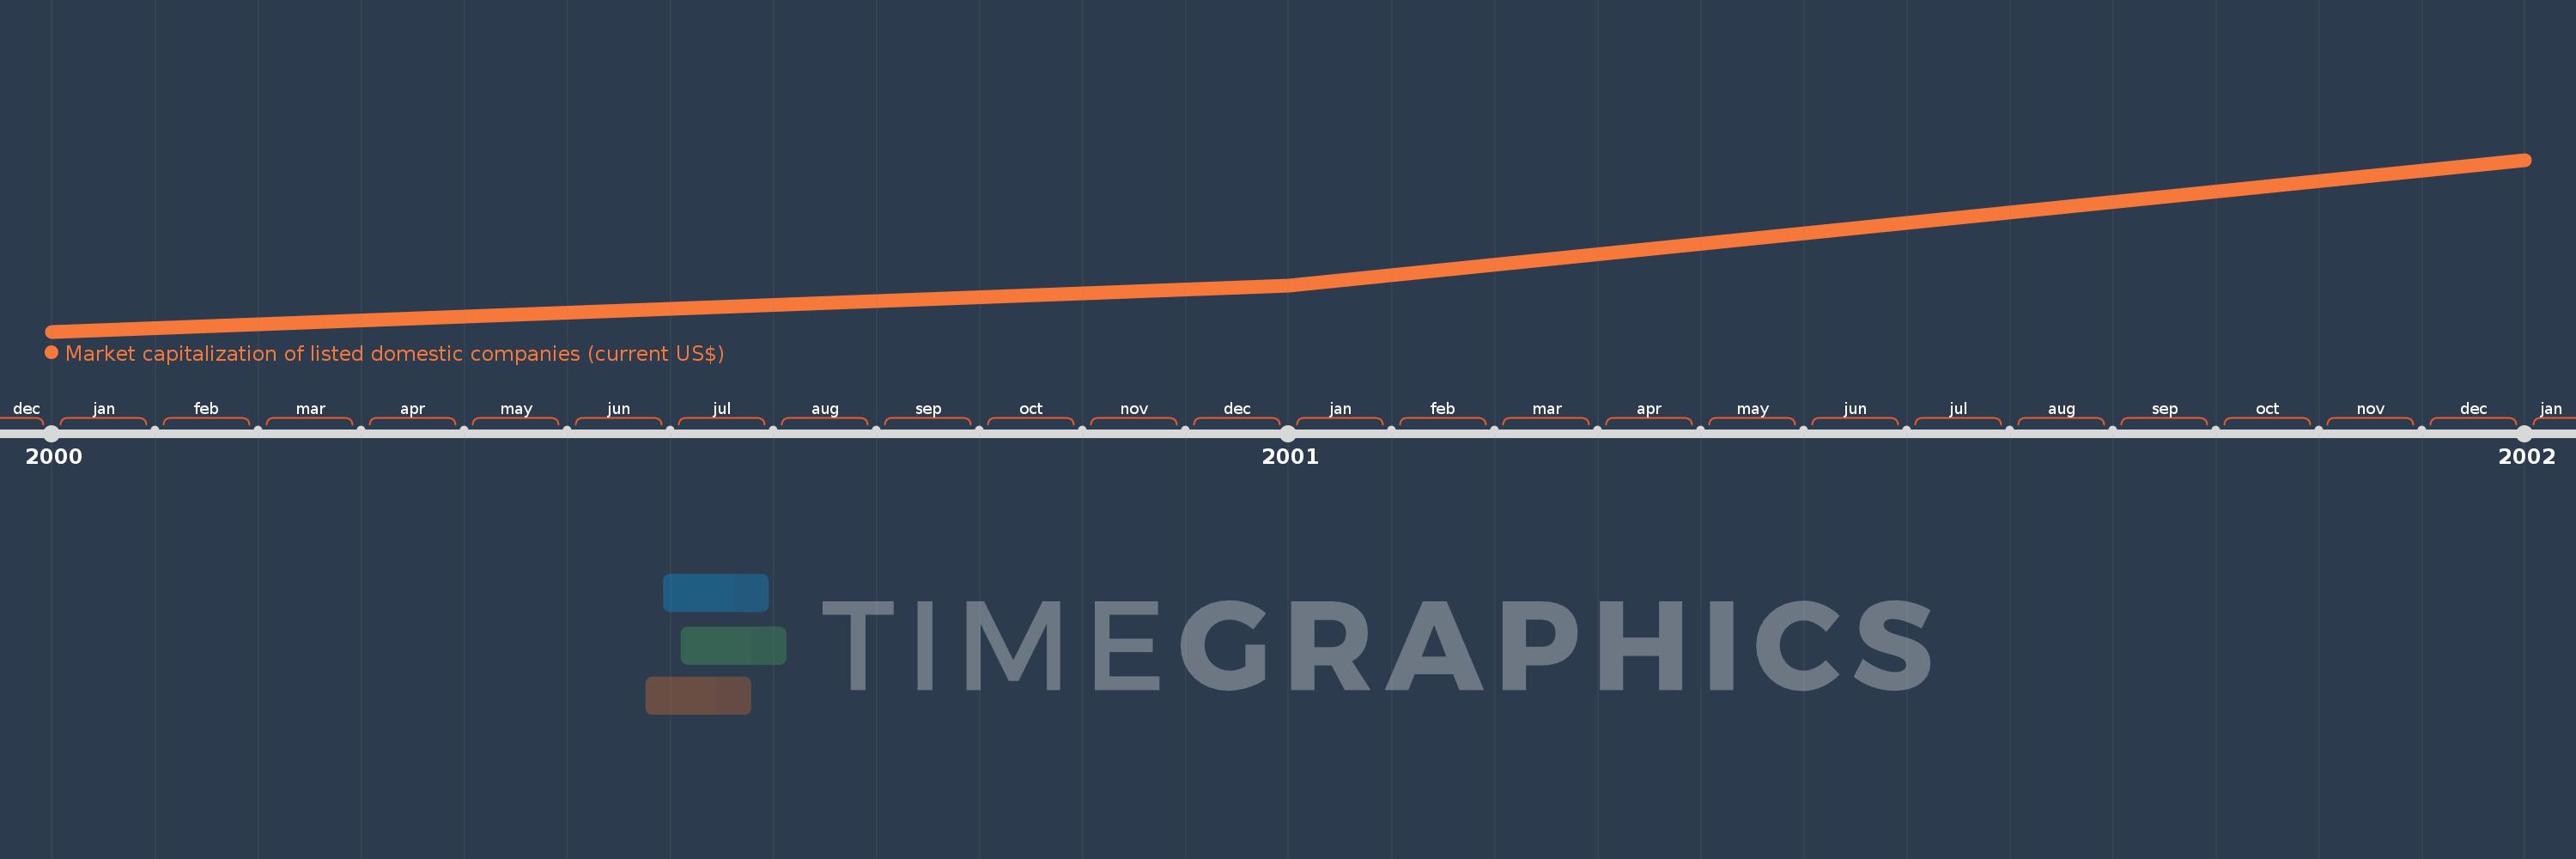
This timeline shows a graph from 2000 to 2002 of Tanzania. No data until 1999. Number of actual observations by date: 3.
Source name:
World Development Indicators
Source organization:
World Federation of Exchanges database.
Categories, topics:
Financial Sector
Last updated:
apr 23, 2017
Indicators value changes by year
Minimum:
171.39 mln
jan 1, 2000
Maximum:
398.1 mln
jan 1, 2002
At the date of observation
Value
Absolute change
Change from the previous value
jan 1, 2000
171.39 mln
+171.39 mln
0.0%
jan 1, 2001
231.48 mln
+60.09 mln
35.06%
jan 1, 2002
398.1 mln
+166.62 mln
71.98%
Ranking of countries by current statistics by years